Design Data Flow. DFD Library

The vector stencils library "DFD, Yourdon and Coad notation" contains 22 DFD elements.
Use it for drawing data flow diagrams (DFD) using Yourdon/ DeMarco notation in the ConceptDraw PRO diagramming and vector drawing software extended with the Data Flow Diagrams solution from the Software Development area of ConceptDraw Solution Park.
Use it for drawing data flow diagrams (DFD) using Yourdon/ DeMarco notation in the ConceptDraw PRO diagramming and vector drawing software extended with the Data Flow Diagrams solution from the Software Development area of ConceptDraw Solution Park.
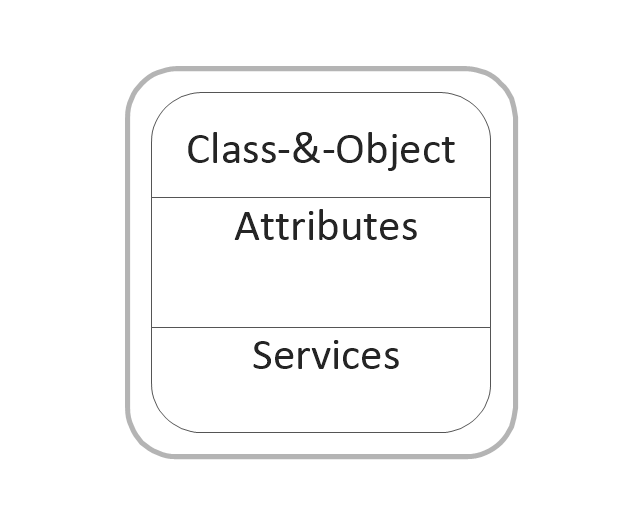
Class and object
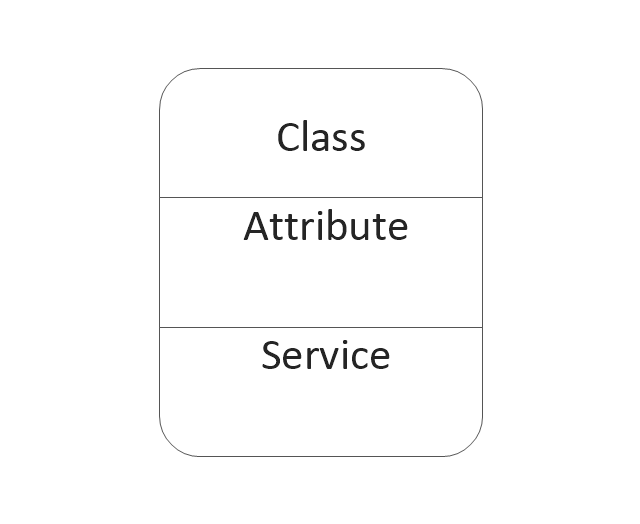
Class
Object state

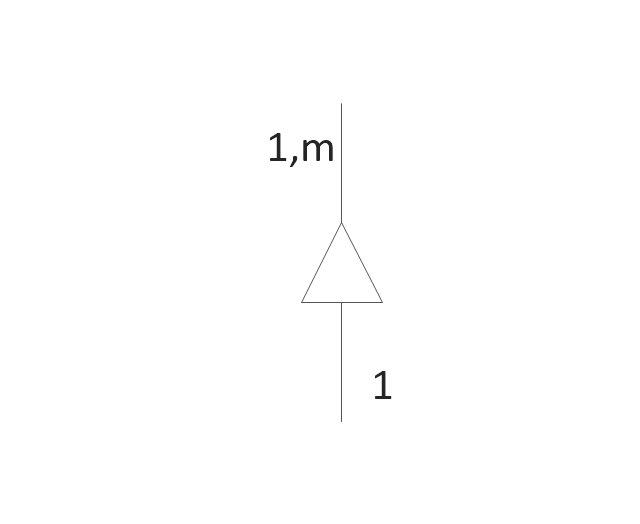
Generalization and specialization structure

Whole-part structure
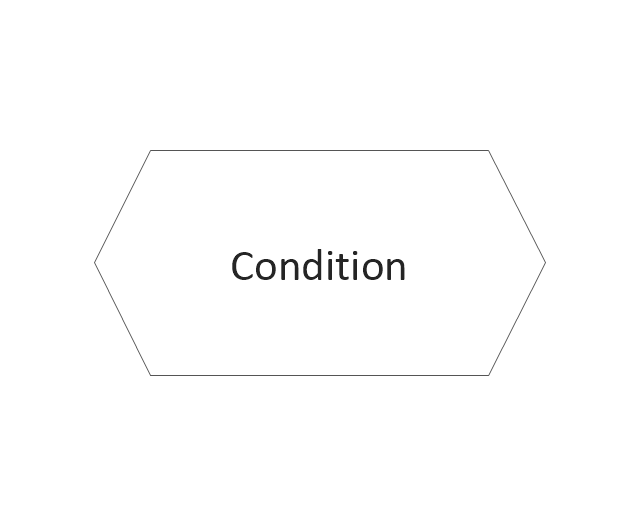
Condition
Loop
External interactor
Data process
Multiple process
State
Multi-state
Stop state

Stop state2
Process
Process (offset)
-dfd,-yourdon-and-coad-notation---vector-stencils-library.png--diagram-flowchart-example.png)
Center to center

Center to center #2

Loop on center
Data store
Instance

Message

Process Flowchart


The vector stencils library "DFD, Yourdon and Coad notation" contains 22 DFD elements.
Use it for drawing data flow diagrams (DFD) using Yourdon/ DeMarco notation in the ConceptDraw PRO diagramming and vector drawing software extended with the Data Flow Diagrams solution from the Software Development area of ConceptDraw Solution Park.
Use it for drawing data flow diagrams (DFD) using Yourdon/ DeMarco notation in the ConceptDraw PRO diagramming and vector drawing software extended with the Data Flow Diagrams solution from the Software Development area of ConceptDraw Solution Park.
Class and object
Class
Object state
Generalization and specialization structure
Whole-part structure
Condition
Loop
External interactor
Data process
Multiple process
State
Multi-state
Stop state
Stop state2
Process
Process (offset)
Center to center
Center to center #2
Loop on center
Data store
Instance
Message
Software and Database Design with ConceptDraw PRO

UML diagramming; designing and prototyping Graphical User Interface (GUI); flowcharts, data flow diagrams; database and ERD diagramming (Chen ERD, Database Model diagram, Express-G, Martin ERD, ORM Diagrams and more); SSADM diagrams, Booch diagrams, Nassi-Shneiderman diagrams with special flowchart symbols.
HelpDesk
How to Create a Data Flow Diagram
 example")
Data Flow Diagram Process

Gane Sarson Diagram

Data Flow Diagram

Entity-Relationship Diagram (ERD) with ConceptDraw PRO

one-to-many, many-to-many.
Draw Entity-Relationship Diagrams (ERD) easily with ConceptDraw extended with Entity-Relationship Diagram (ERD) Solution from the Software Development Area. Use ERD software to create ER diagram.

Program Structure Diagram

HelpDesk
Accounting Information Systems Flowchart Symbols

UML Flowchart Symbols

The Rapid UML solution for ConceptDraw PRO software offers diversity of UML flowchart symbols for drawing all types of UML diagrams.
 ATM UML Diagrams
The ATM UML Diagrams solution lets you create ATM solutions and UML examples. Use ConceptDraw PRO as a UML diagram creator to visualize a banking system.
- Draw Dfd For Liabrary Structure
- Data Flow Diagram | Data Flow Diagram Symbols. DFD Library ...
- Level 0 Dfd Of Library Management System
- Data Flow Diagram
- Structured Systems Analysis and Design Method (SSADM) with ...
- How to Create a Data Flow Diagram using ConceptDraw PRO | Data ...
- Data Flow Diagram ( DFD ) | Context Diagram Template | DFD Library ...
- Program Structure Diagram | IDEF0 Diagrams | IDEF0 Visio | Library ...
- Draw Data Flow Diagram For Library Management System
- Structured Systems Analysis and Design Method (SSADM) with ...
- Data Flow Diagram | Basic Flowchart Symbols and Meaning ...
- DFD Library System | Data Flow Diagram Symbols. DFD Library ...
- Data Flow Diagrams with ConceptDraw PRO | Data Flow Diagram
- DFD Library System | Data Flow Diagram Symbols. DFD Library ...
- Data Flow Diagram Symbols. DFD Library
- DFD , Yourdon and Coad notation - Vector stencils library | Data ...
- Data Flow Diagram Symbols. DFD Library | Entity Relationship ...
- Data Flow Diagram Symbols. DFD Library | Data Flow Diagram ...
- Data flow Model Diagram | Data Flow Diagram Model | Taxi Service ...
- DFD , Yourdon and Coad notation - Vector stencils library | Data ...
- ERD | Entity Relationship Diagrams, ERD Software for Mac and Win
- Flowchart | Basic Flowchart Symbols and Meaning
- Flowchart | Flowchart Design - Symbols, Shapes, Stencils and Icons
- Flowchart | Flow Chart Symbols
- Electrical | Electrical Drawing - Wiring and Circuits Schematics
- Flowchart | Common Flowchart Symbols
- Flowchart | Common Flowchart Symbols