Process Flowchart


Bar Diagrams for Problem Solving. Create business management bar charts with Bar Graphs Solution

Cross-Functional Flowchart

Use cross-functional flowcharts to show the relationship between a business process and the functional units (such as departments) responsible for that process. To create it use the best flowchart maker of ConceptDraw PRO.

Venn Diagram Examples for Problem Solving. Venn Diagram as a Truth Table

 25 Typical Orgcharts
The 25 Typical Orgcharts solution contains powerful organizational structure and organizational management drawing tools, a variety of professionally designed organization chart and matrix organization structure samples, 25 templates based on various orga
 Audit Flowcharts
Audit flowcharts solution extends ConceptDraw PRO software with templates, samples and library of vector stencils for drawing the audit and fiscal flow charts.
 Seven Management and Planning Tools
Seven Management and Planning Tools solution extends ConceptDraw PRO and ConceptDraw MINDMAP with features, templates, samples and libraries of vector stencils for drawing management mind maps and diagrams.
"Most methods of diagramming in pedagogy are based on the work of Alonzo Reed and Brainerd Kellogg in their book Higher Lessons in English, first published in 1877, though the method has been updated with recent understanding of grammar. ...
Some schoolteachers continue to use the Reed-Kellogg system in teaching grammar, but others have discouraged it in favor of more modern tree diagrams. However, these modern tree structures draw on techniques that were already present in Reed-Kellogg diagrams. Reed and Kellogg defend their system in the preface to their grammar:
The Objections to the Diagram.--The fact that the pictorial diagram groups the parts of a sentence according to their offices and relations, and not in the order of speech, has been spoken of as a fault. It is, on the contrary, a merit, for it teaches the pupil to look through the literary order and discover the logical order. He thus learns what the literary order really is, and sees that this may be varied indefinitely, so long as the logical relations are kept clear.
The assertion that correct diagrams can be made mechanically is not borne out by the facts. It is easier to avoid precision in oral analysis than in written. The diagram drives the pupil to a most searching examination of the sentence, brings him face to face with every difficulty, and compels a decision on every point.
... Reed-Kellogg diagrams abstract away from actual word order in order to focus more intently on how words in sentences function and relate to each other.
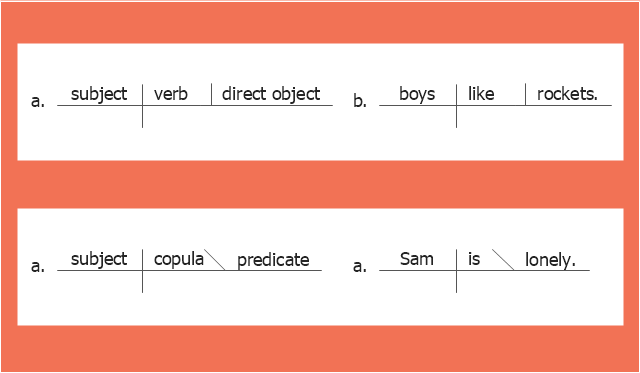
The Reed-Kellogg System. Simple sentences in the Reed-Kellogg system are diagrammed in accordance with the ... basic schemata" shown in this diagram example. [Sentence diagram. Wikipedia]
The example "The Reed-Kellogg system - Basic schemata" was created using the ConceptDraw PRO diagramming and vector drawing software extended with the Language Learning solution from the Science and Education area of ConceptDraw Solution Park.
Some schoolteachers continue to use the Reed-Kellogg system in teaching grammar, but others have discouraged it in favor of more modern tree diagrams. However, these modern tree structures draw on techniques that were already present in Reed-Kellogg diagrams. Reed and Kellogg defend their system in the preface to their grammar:
The Objections to the Diagram.--The fact that the pictorial diagram groups the parts of a sentence according to their offices and relations, and not in the order of speech, has been spoken of as a fault. It is, on the contrary, a merit, for it teaches the pupil to look through the literary order and discover the logical order. He thus learns what the literary order really is, and sees that this may be varied indefinitely, so long as the logical relations are kept clear.
The assertion that correct diagrams can be made mechanically is not borne out by the facts. It is easier to avoid precision in oral analysis than in written. The diagram drives the pupil to a most searching examination of the sentence, brings him face to face with every difficulty, and compels a decision on every point.
... Reed-Kellogg diagrams abstract away from actual word order in order to focus more intently on how words in sentences function and relate to each other.
The Reed-Kellogg System. Simple sentences in the Reed-Kellogg system are diagrammed in accordance with the ... basic schemata" shown in this diagram example. [Sentence diagram. Wikipedia]
The example "The Reed-Kellogg system - Basic schemata" was created using the ConceptDraw PRO diagramming and vector drawing software extended with the Language Learning solution from the Science and Education area of ConceptDraw Solution Park.
Sentence diagram
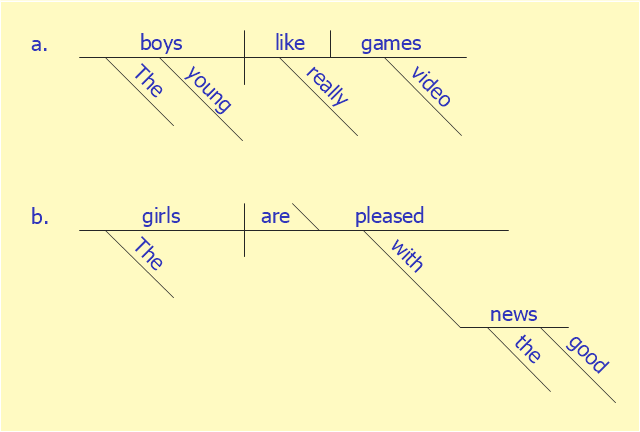
This sentence diagram example was redesigned from the Wikipedia file: Examples of Reed-Kellogg diagrams.jpg.
[en.wikipedia.org/ wiki/ File:Examples_ of_ Reed-Kellogg_ diagrams.jpg]
This file is licensed under the Creative Commons Attribution-Share Alike 3.0 Unported license. [creativecommons.org/ licenses/ by-sa/ 3.0/ deed.en]
"Most methods of diagramming in pedagogy are based on the work of Alonzo Reed and Brainerd Kellogg in their book Higher Lessons in English, first published in 1877, though the method has been updated with recent understanding of grammar. Reed and Kellogg were preceded, and their work probably informed, by W. S. Clark, who published his "balloon" method of depicting grammar in his 1847 book A Practical Grammar: In Which Words, Phrases & Sentences are Classified According to Their Offices and Their Various Relationships to Each Another.
Some schoolteachers continue to use the Reed-Kellogg system in teaching grammar, but others have discouraged it in favor of more modern tree diagrams. However, these modern tree structures draw on techniques that were already present in Reed-Kellogg diagrams. Reed and Kellogg defend their system in the preface to their grammar:
The Objections to the Diagram. - The fact that the pictorial diagram groups the parts of a sentence according to their offices and relations, and not in the order of speech, has been spoken of as a fault. It is, on the contrary, a merit, for it teaches the pupil to look through the literary order and discover the logical order. He thus learns what the literary order really is, and sees that this may be varied indefinitely, so long as the logical relations are kept clear.
The assertion that correct diagrams can be made mechanically is not borne out by the facts. It is easier to avoid precision in oral analysis than in written. The diagram drives the pupil to a most searching examination of the sentence, brings him face to face with every difficulty, and compels a decision on every point.
These statements bear witness to the fact that Reed-Kellogg diagrams abstract away from actual word order in order to focus more intently on how words in sentences function and relate to each other." [Sentence diagram. Wikipedia]
The examples of Reed-Kellogg diagrams was created using the ConceptDraw PRO diagramming and vector drawing software extended with the Language Learning solution from the Science and Education area of ConceptDraw Solution Park.
Sentence diagram
 Project Management Area
Project Management area provides Toolbox solutions to support solving issues related to planning, tracking, milestones, events, resource usage, and other typical project management functions.
 PM Response
The PM Response solution extends the functional abilities in project management for all three ConceptDraw products by helping to improve the response time to project changes, to plan on how to effectively respond on issues and events impacting the project. It supplies the project managers, team leaders, and all other project participants with wide abilities of iteration planning, creative collaboration, effective decision-making, discussions of the project layout approaches and solving the project challenges, lets them use mind mapping technique for iteration planning and applying the project changes, to represent the projects data as Mind Maps and use them to construct the clear plans, to convert project maps to project implementations, to use different kinds of Visual diagrams to solve the current project problems and to make correct decisions, to plan resources usage and to respond to changes in the project environment.
 SWOT and TOWS Matrix Diagrams
SWOT and TOWS Matrix Diagrams solution extends ConceptDraw PRO and ConceptDraw MINDMAP software with features, templates, samples and libraries of vector stencils for drawing SWOT and TOWS analysis matrices and mind maps.
 Block Diagrams
Block diagrams solution extends ConceptDraw PRO software with templates, samples and libraries of vector stencils for drawing the block diagrams.
 Flowcharts
The Flowcharts solution for ConceptDraw PRO is a comprehensive set of examples and samples in several varied color themes for professionals that need to represent graphically a process. Solution value is added by the basic flow chart template and shapes' libraries of flowchart notation. ConceptDraw PRO flow chart creator lets one depict the processes of any complexity and length, as well as design the Flowchart either vertically or horizontally.
- Decision tree diagram | Decision Making | Influence Diagram ...
- Process Flowchart | How to Make SWOT Analysis in a Word ...
- Venn Diagram Template for Word | Fully Connected Network ...
- How to Make SWOT Analysis in a Word Document | SWOT and ...
- Microsoft Office Drawing Software
- How to Add a Block Diagram to a MS Word ™ Document Using ...
- Microsoft Azure | Microsoft Exchange - Vector stencils library | How ...
- Root cause analysis tree diagram - Template | PROBLEM ...
- Process decision program chart (PDPC) - Personal activity | Process ...
- How to Draw a Line Graph | How to Draw a Line Chart Quickly ...
- Decision Tree Templates For Free
- Computer Network Diagrams | Draw Diagram on Mac | How to ...
- Tree Network Topology Diagram | Fault Tree Analysis Diagrams ...
- Line Graph Charting Software | Bar Chart Software | How to Input ...
- Editable Org Chart
- Solve Pie Chart Graph Ana Diagrams With Picture
- Microsoft Office Visio 2010 Free Download
- Draw A Research Analysis Diagram
- Decision Tree Maker
- Chart Maker for Presentations | Bar Chart Software | Pie Chart ...
- ERD | Entity Relationship Diagrams, ERD Software for Mac and Win
- Flowchart | Basic Flowchart Symbols and Meaning
- Flowchart | Flowchart Design - Symbols, Shapes, Stencils and Icons
- Flowchart | Flow Chart Symbols
- Electrical | Electrical Drawing - Wiring and Circuits Schematics
- Flowchart | Common Flowchart Symbols
- Flowchart | Common Flowchart Symbols