 Bar Graphs
The Bar Graphs solution enhances ConceptDraw PRO v10 functionality with templates, numerous professional-looking samples, and a library of vector stencils for drawing different types of Bar Graphs, such as Simple Bar Graph, Double Bar Graph, Divided Bar Graph, Horizontal Bar Graph, Vertical Bar Graph, and Column Bar Chart.
Bar Chart Software

HelpDesk
How to Create a Bar Chart in ConceptDraw PRO

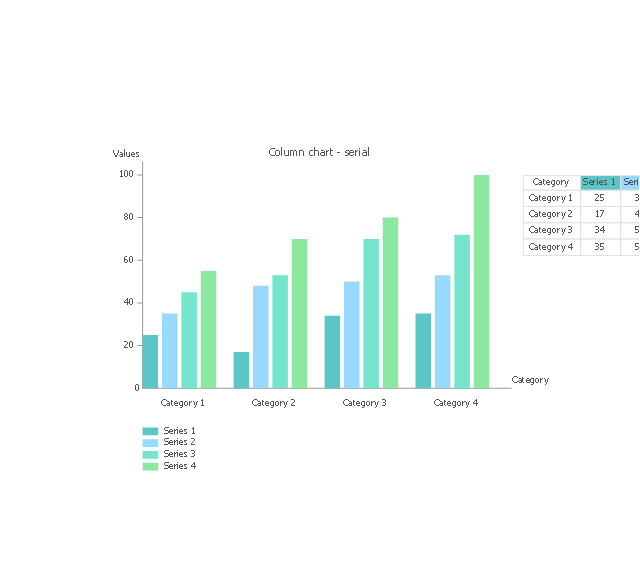
Bar charts are widely used to show and compare the values of the same parameters for different data groups.
The bar graph can be vertical or horizontal. This depends on the amount of categories. There are many methods in which bar graph can be built and this makes it a very often used chart type. Usually, a bar chart is created so that the bars are placed vertically. Such arrangement means that the bar's height value is proportional to the category value. Nevertheless, a bar chart can be also drawn horizontally. This means that the longer the bar, the bigger the category. Thus, a bar chart is a good way to present the relative values of different measured items. The ConceptDraw Bar Graphs solution allows you to draw a bar chart quickly using a vector library, containing the set of various bar charts objects.
Bar Graph

HelpDesk
How to Draw a Divided Bar Chart in ConceptDraw PRO

 ConceptDraw Solution Park
ConceptDraw Solution Park collects graphic extensions, examples and learning materials
Bar Charts

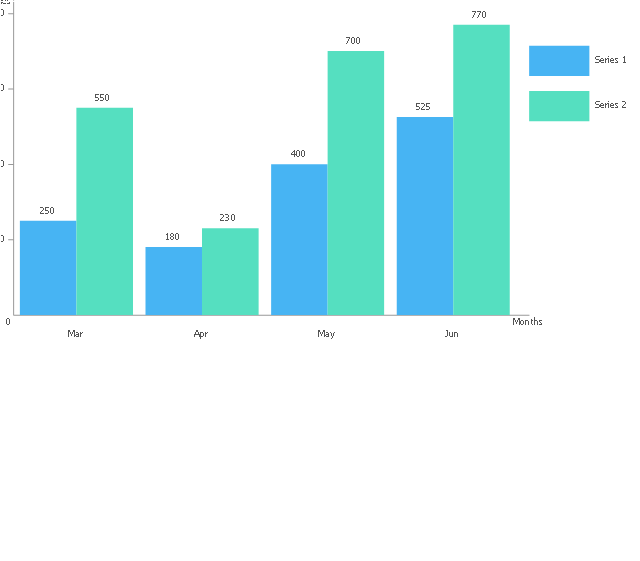
The vector stencils library "Bar charts" contains 6 templates of bar and column charts for visualizing quantitative and statistical data comparison and changes in time series. Use these shapes to draw your bar graphs in the ConceptDraw PRO diagramming and vector drawing software extended with the Bar Graphs solution from the Graphs and Charts area of ConceptDraw Solution Park.
Vertical bar chart

Horizontal bar chart

Double bar chart
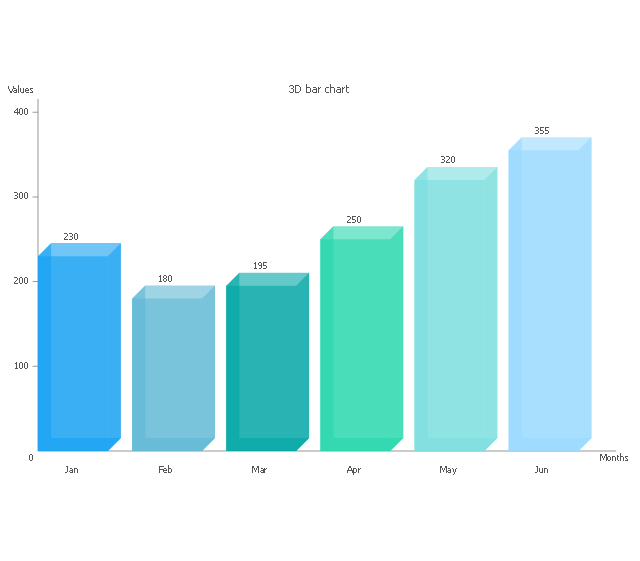
3D bar chart
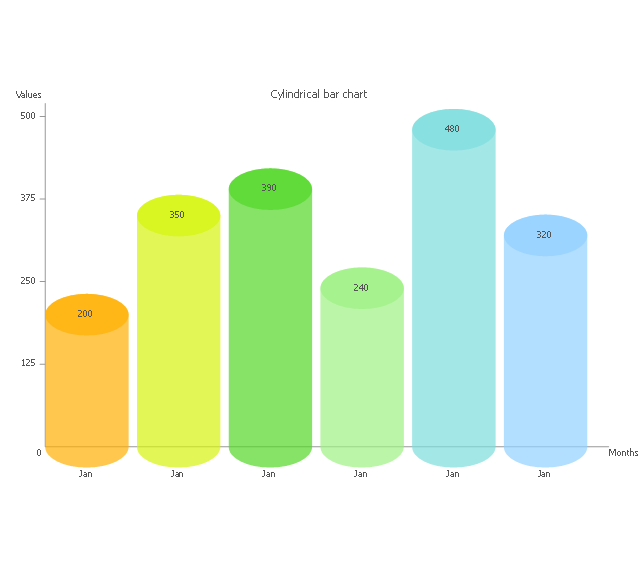
Cylindrical bar chart
Coordinate system 3D
 Basic Diagramming
This solution extends ConceptDraw PRO software with the specific tools you need to easily draw flowcharts, block diagrams, histograms, pie charts, divided bar diagrams, line graphs, circular arrows diagrams, Venn diagrams, bubble diagrams and concept maps
The vector stencils library "Picture Graphs" contains templates of picture bar graphs for visual data comparison. Use these shapes to draw your pictorial bar charts in the ConceptDraw PRO diagramming and vector drawing software extended with the Picture Graphs solution from the Graphs and Charts area of ConceptDraw Solution Park.
Arrow picture graph (control dots)
Arrow picture graph (text -> height)
Picture graph (person)
-picture-graphs---vector-stencils-library.png--diagram-flowchart-example.png)
Picture graph (coins)
-picture-graphs---vector-stencils-library.png--diagram-flowchart-example.png)
Waterfall Bar Chart

 Picture Graphs
Typically, a Picture Graph has very broad usage. They many times used successfully in marketing, management, and manufacturing. The Picture Graphs Solution extends the capabilities of ConceptDraw PRO v10 with templates, samples, and a library of professionally developed vector stencils for designing Picture Graphs.
How to Draw a Line Graph

Basic Diagramming


Chart Software for Better Presentations

Graphs and Charts Area provide a wide collection of professional looking predesigned templates, samples and ready-to-use vector stencils that will help you to draw the charts and diagrams of various types: Pie Charts, Donut Charts, Line Charts, Column Charts, Bar Charts, Pyramids, Scatter Charts, Venn Diagrams, Spider Charts, Area Charts, Divided Bar Graphs.
Picture Graph

HelpDesk
How to Create Data-driven Infographics

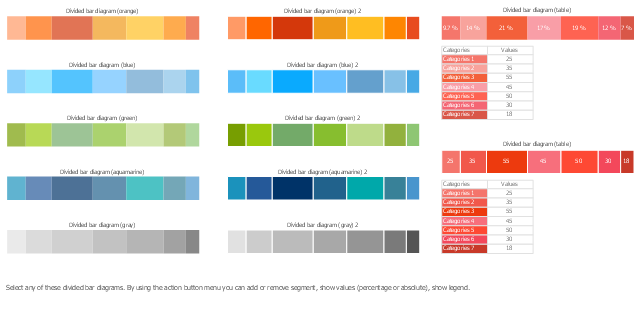
A Divided Bar graph is a rectangle divided into smaller rectangles along its length in proportion to the data. Segments in a Divided Bar represent a set of quantities according to the different proportions of the total amount.
Divided Bars are used for visual representation of the collected information.
The design elements library Divided bar diagrams contains the 10 vector templates of divided bar charts.
Use the design elements library Divided bar diagrams to draw your diagrams and infographics using the ConceptDraw PRO diagramming and vector drawing software.
The example "Design elements - Divided bar diagrams" was created using ConceptDraw PRO diagramming and vector drawing software extended with the Divided Bar Diagrams solution from the Graphs and Charts area of ConceptDraw Solution Park.
Divided bar chart templates
Best Diagramming Software for Mac


The Best Drawing Program for Mac

- Picture Graphs | Line Graphs | Bar Graphs | Graphs
- How to Draw a Divided Bar Chart in ConceptDraw PRO | Divided ...
- Sales Growth. Bar Graphs Example | Financial Comparison Chart ...
- Sales Growth. Bar Graphs Example | Bar Graphs | Sales Dashboard ...
- Bar Chart Examples | Sales Growth. Bar Graphs Example | Bar ...
- Bar Graphs | Blank Scatter Plot | Basic Diagramming | Sample Bar ...
- Bar Graphs | Bar Chart Examples | Bar Chart Software | Bar Graph
- Bar Chart Software | Bar Chart Examples | The Best Drawing ...
- Bar Graphs | Bar Diagrams for Problem Solving. Create event ...
- Marketing | Line Graphs | Bar Graphs | Swot Graph
- Bar Graphs | Picture Graphs | Divided Bar Diagrams | Bar Graphs On ...
- Picture Graphs | Design elements - Picture graphs | How to Create a ...
- Double Bar Graph | Create Graphs and Charts | Design elements ...
- Bar Chart Examples | Column Chart Examples | Bar Graphs
- Bar Chart Examples | Bar Chart Software | Bar Graphs | Bar Graph ...
- Bar Graph
- Basic Diagramming | Picture Graphs | Create Graphs and Charts ...
- Bar Chart Examples | Column Chart Software | How to Create a Bar ...
- Bar Graphs | Bar Chart Software | Bar Chart Examples | Bar Diagram
- Create Graphs and Charts | Line Graph Charting Software ...
- ERD | Entity Relationship Diagrams, ERD Software for Mac and Win
- Flowchart | Basic Flowchart Symbols and Meaning
- Flowchart | Flowchart Design - Symbols, Shapes, Stencils and Icons
- Flowchart | Flow Chart Symbols
- Electrical | Electrical Drawing - Wiring and Circuits Schematics
- Flowchart | Common Flowchart Symbols
- Flowchart | Common Flowchart Symbols