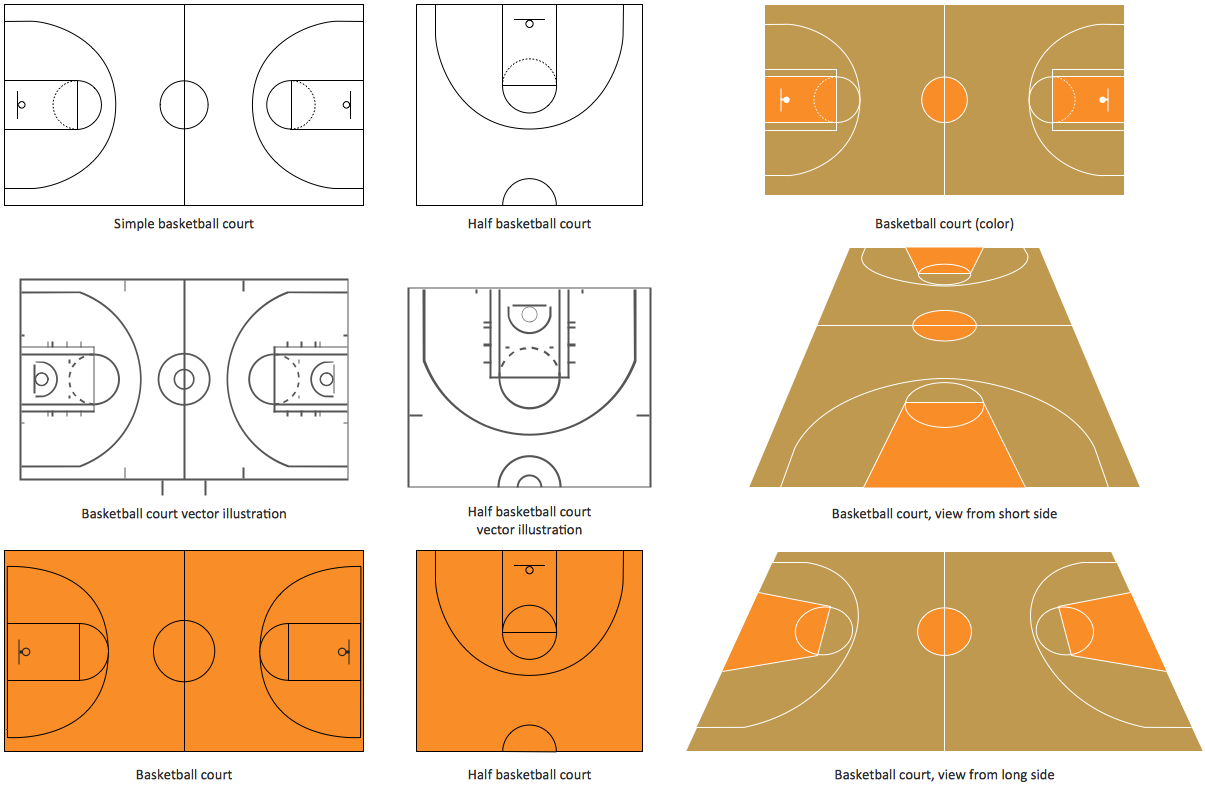
Basketball Court Diagram and Basketball Positions
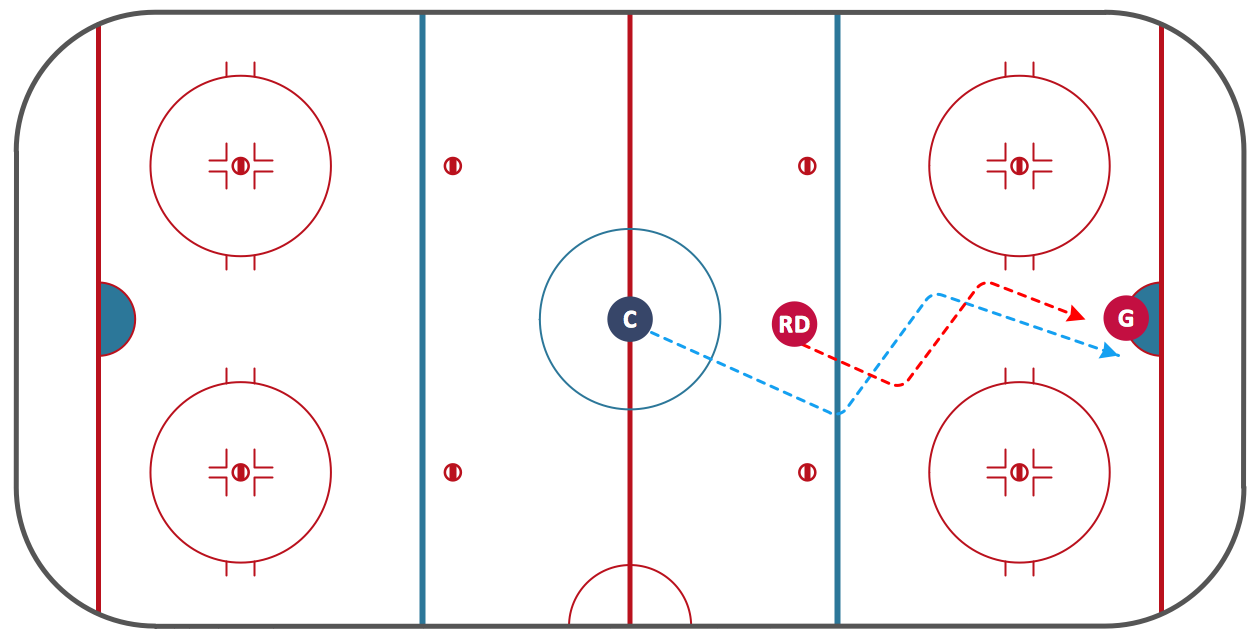
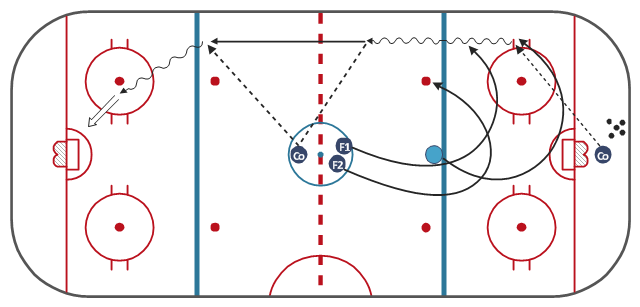
Ice Hockey Diagram – Penalty Kill Forecheck Angling Drill

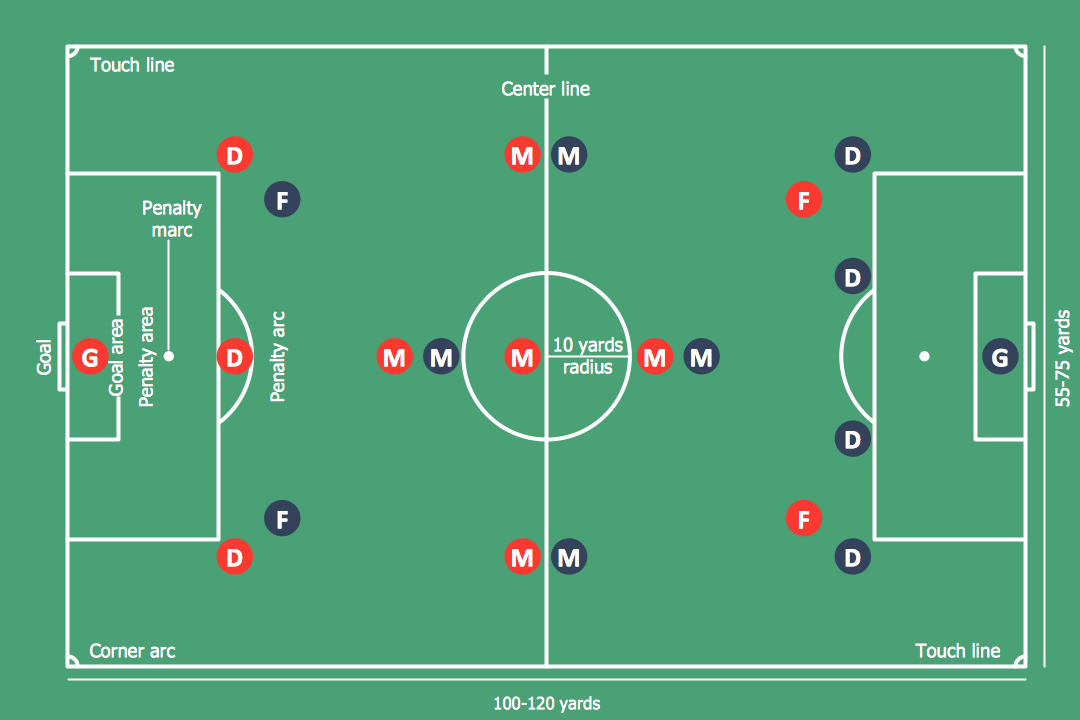
Soccer (Football) Positions
Ice Hockey Diagram – Deke Technique
Basketball Field in the Vector
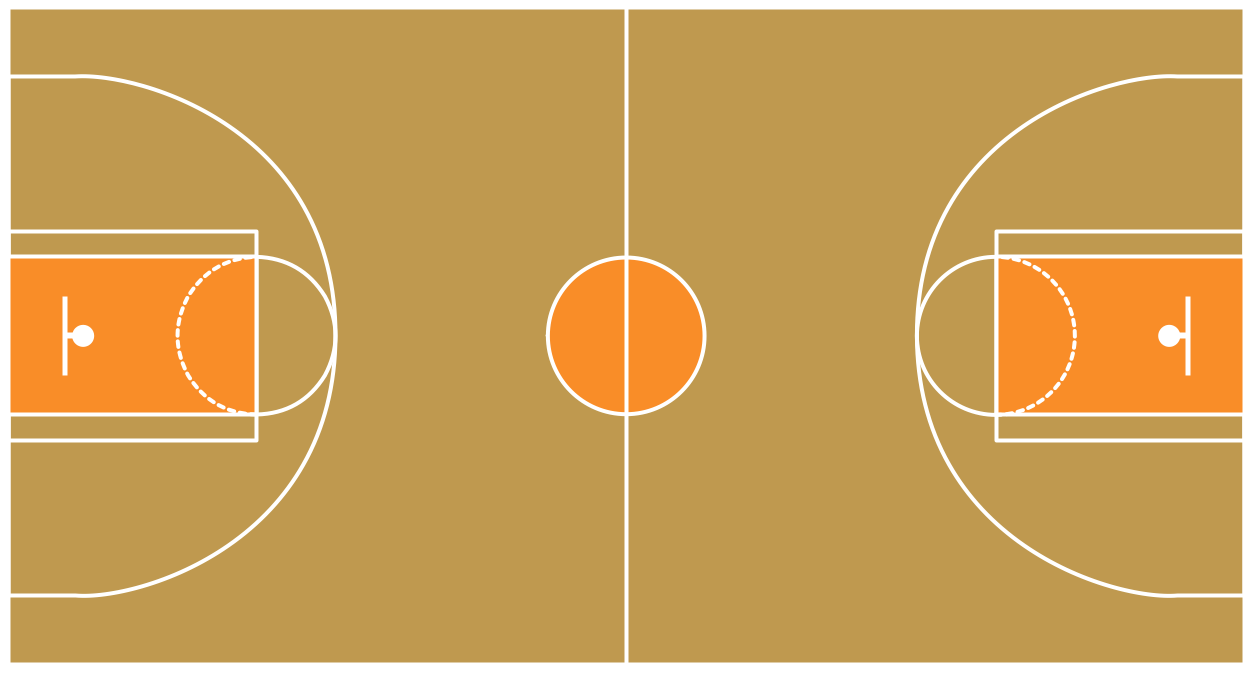
All courts objects are designed according to the real basketball courts dimensions. Simply drop the needed basketball field in the vector from the library to design your own basketball diagram.
How to Draw EPC Diagram Quickly

An EPC diagram is a complex flowchart that shows different business processes through various workflows. The workflows are seen as functions and events that are connected by different teams or people, as well as tasks that allow business processes to be executed.
ConceptDraw DIAGRAM is a software for making EPC diagrams that allows managers visually present business process models for making decisions for business.

"A penalty in ice hockey is a punishment for an infringement of the rules. Most penalties are enforced by detaining the offending player within a penalty box for a set number of minutes, during which the player can not participate in play. Penalties are called and enforced by the referee, or in some cases the linesmen. The offending team usually may not replace the player on the ice, leaving them short handed as opposed to full strength. The opposing team is said to be on a power play, having one player more on the ice than the short-handed team. The short handed team is said to be "penalty killing" until the penalty expires and the penalized player returns to play. While standards vary somewhat between leagues, most leagues recognize several common degrees of penalty, as well as common infractions." [Penalty (ice hockey). Wikipedia]
The ice hockey diagram example "Penalty kill forecheck angling drill" was created using the ConceptDraw PRO diagramming and vector drawing software extended with the Hockey solution from the Sport area of ConceptDraw Solution Park.
The ice hockey diagram example "Penalty kill forecheck angling drill" was created using the ConceptDraw PRO diagramming and vector drawing software extended with the Hockey solution from the Sport area of ConceptDraw Solution Park.
Ice hockey diagram example
 Fire and Emergency Plans
It's a good idea to have an emergency exit strategy in place for your home or business. ConceptDraw gives you the tools to create your own fire and emergency plan, tailored to your setting.
UML Diagram

Create unified modeling language (UML) diagrams with ConceptDraw.
 Cafe and Restaurant Floor Plans
Restaurants and cafes are popular places for recreation, relaxation, and are the scene for many impressions and memories, so their construction and design requires special attention. Restaurants must to be projected and constructed to be comfortable and e
Entity Relationship Diagram Examples

ConceptDraw DIAGRAM diagramming and vector drawing software gives the ability to describe a database using the Entity-Relationship model. Entity-Relationship Diagram(ERD) solution from the Software Development area supplies the ConceptDraw DIAGRAM with icons advocated by Chen's and Crow’s Foot notation that can be used when describing a database.

IDEF0 Diagram

 Food Court
Use the Food Court solution to create food art. Pictures of food can be designed using libraries of food images, fruit art and pictures of vegetables.
 Business Process Diagrams
Business Process Diagrams solution extends the ConceptDraw DIAGRAM BPM software with RapidDraw interface, templates, samples and numerous libraries based on the BPMN 1.2 and BPMN 2.0 standards, which give you the possibility to visualize equally easy simple and complex processes, to design business models, to quickly develop and document in details any business processes on the stages of project’s planning and implementation.
Design Pictorial Infographics. Design Infographics

- Draw A Well Labelled Diagram Of A Hockey Field With Their
- Draw And Label A Hockey Pitch
- Diagram Of A Hockey Pitch And Labelled
- Draw And Label A Well Standard Hockey Pitch
- Draw And Label A Standard Hockey Field
- Diagram Of A Standard And Well Labelled Hockey Pitch
- A Well Labelled Diagram Of A Hockey Pitch
- Well Labelled Hockey Field
- Draw And Lebel The Hockey Pitch
- Draw And Lebel Hockey Pitch
- Diagramm Of A Well Labelled Hockey Pitch
- Standard Hockey Pitch With Well Labelled
- A Well Labeled Standard Hockey Pitch
- Labeled Hockey Pitch
- A Well Leabelled Diagram Of A Hockey Pitch
- Hockey Pitch And Its Labelling
- Draw A Standard Hockey Pitch
- Well Labelled Diagram Of An Hockey Pitch
- Draw A Well Label Hockey Field
- Draw And Label A Standard Basketball Court
- ERD | Entity Relationship Diagrams, ERD Software for Mac and Win
- Flowchart | Basic Flowchart Symbols and Meaning
- Flowchart | Flowchart Design - Symbols, Shapes, Stencils and Icons
- Flowchart | Flow Chart Symbols
- Electrical | Electrical Drawing - Wiring and Circuits Schematics
- Flowchart | Common Flowchart Symbols
- Flowchart | Common Flowchart Symbols