Process Flowchart
ConceptDraw is Professional business process mapping software for making process flow diagram, workflow diagram, general flowcharts and technical illustrations for business documents. It is includes rich examples, templates, process flowchart symbols. ConceptDraw flowchart maker allows you to easier create a process flowchart. Use a variety of drawing tools, smart connectors, flowchart symbols and shape libraries to create flowcharts of complex processes, process flow diagrams, procedures and information exchange.
 Event-driven Process Chain Diagrams
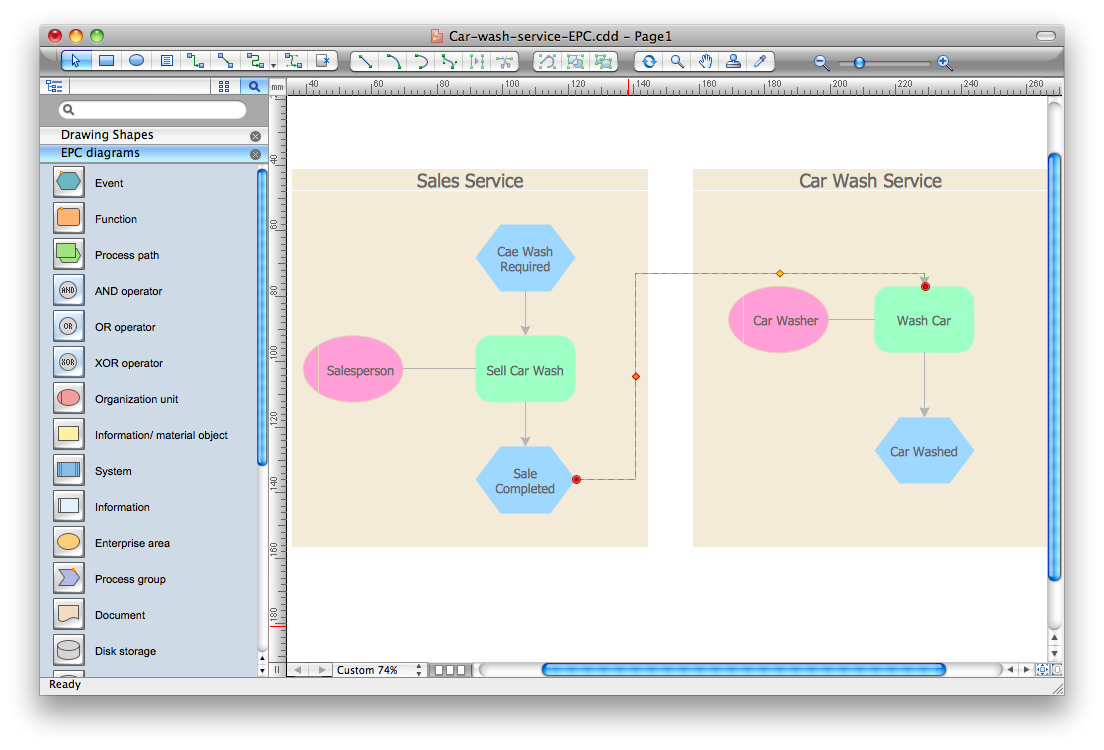
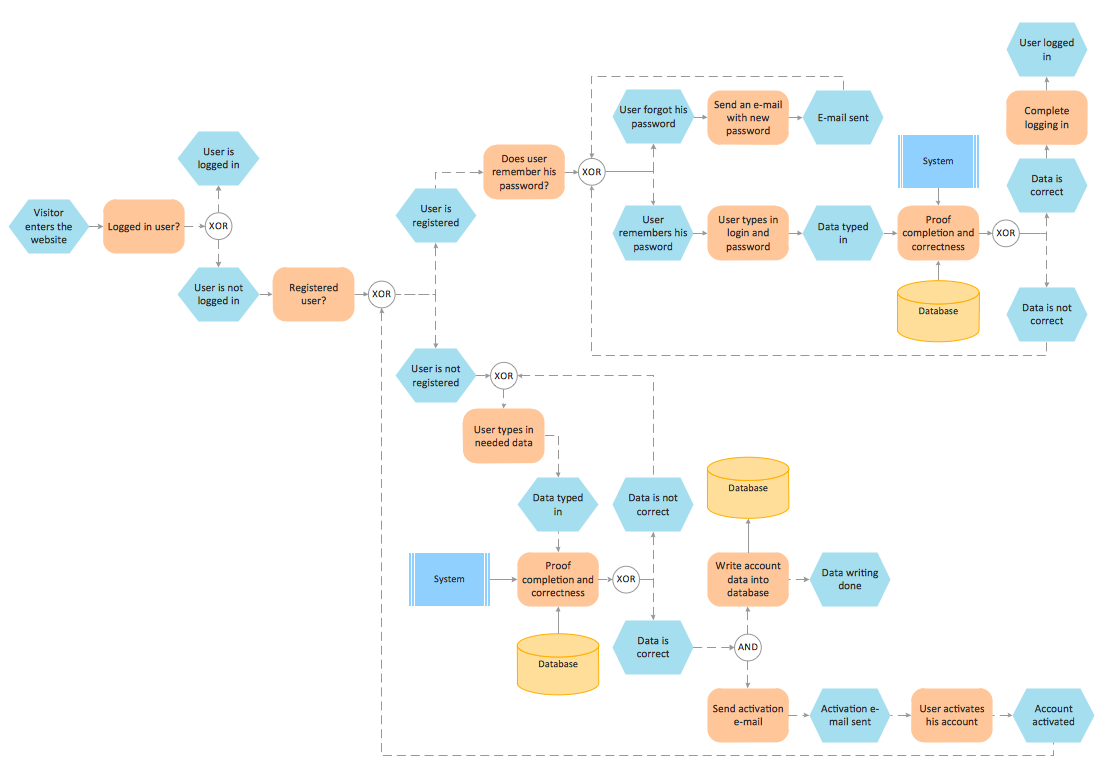
Event-driven Process Chain (EPC) Diagram is a type of flowchart widely used for modeling in business engineering and reengineering, business process improvement, and analysis. EPC method was developed within the Architecture of Integrated Information Systems (ARIS) framework.
Business process Flow Chart — Event-Driven Process chain (EPC) diagrams
Event-Driven Process chain Diagrams for improvement throughout an organisation. Best software for Process Flow Diagram. The Event-driven Process Chain (EPC) Diagrams allows managers to plan processes and resources.HelpDesk
How to Draw a Fishbone Diagram with ConceptDraw PRO
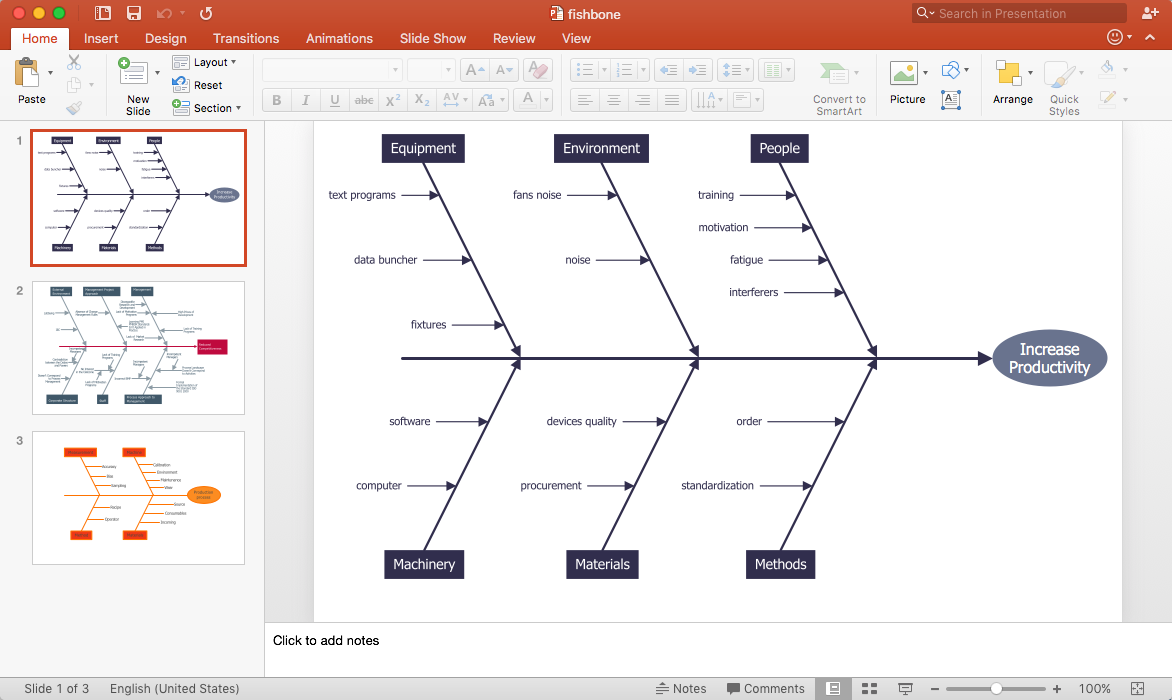
Fishbone (Ishikawa) Diagram is often used in business to determine the cause of some problem. A Fishbone diagram is also called cause-and-effect diagram.The main goal of the Fishbone diagram is to illustrate in a graphical way the relationship between a given outcome and all the factors that influence this outcome. The complete diagram resembles a fish skeleton as its name implies. Cause and Effect analysis is used in management to identify the possible causes of a problem in order to eliminate them. The ability to create a Fishbone Diagram is supported by the Fishbone Diagram solution.Graphical Symbols to use in EPC diagrams
Event-Driven Process Chain Diagrams for improvement throughout an organisation.ConceptDraw PRO - software that reduces the time needed to create a business process model.
Design Elements for UML Diagrams
The Rapid UML solution from Software Development area of ConceptDraw Solution Park includes 13 vector stencils libraries for drawing the UML 2.4 diagrams using ConceptDraw PRO diagramming and vector drawing software.HelpDesk
Event-driven Process Chain (EPC) Diagram Software
An EPC diagram is a type of flowchart used in business process analysis. It shows different business processes through various work flows. The workflows are shown as processes and events that are related to different executes and tasks that allow business workflow to be completed.An EPC diagram shows different business processes through various workflows. The workflows are seen as functions and events that are connected by different teams or people, as well as tasks that allow business processes to be executed. The best thing about this type of enterprise modelling is that creating an EPC diagram is quick and simple as long as you have the proper tool. One of the main usages of the EPC diagrams is in the modelling, analyzing and re-engineering of business processes. With the use of the flowchart, businesses are able to see inefficiencies in the processes and modify to make them more productive. Event-driven process chain diagrams are also used to configure an enterprise resource pla
Event-Driven Process Chain Diagram Software
It’s very easy, quick and convenient to draw the Event-driven Process Chain (EPC) diagrams in ConceptDraw PRO diagramming and vector drawing software using the Event-driven Process Chain Diagrams Solution from the Business Processes area of ConceptDraw Solution Park.HelpDesk
How to Create a Timeline Diagram in ConceptDraw PRO
A Timeline is a chart which displays a project plan schedule in chronological order. A Timeline is used in project management to depict project milestones and visualize project phases, and show project progress. The graphic form of a timeline makes it easy to understand critical project milestones, such as the progress of a project schedule. Timelines are particularly useful for project scheduling or project management when accompanied with a Gantt chart. It captures the main of what the project will accomplish and how it will be done. making a project timeline is one of the most important skills a project manager needs have. Making comprehensive, accurate timelines allows you getting every project off in the best way. ConceptDraw PRO allows you to draw a timeline charts using special library.Bar Diagrams for Problem Solving. Create event management bar charts with Bar Graphs Solution
Create bar charts for event management problem solving and visual data comparison using the ConceptDraw PRO diagramming and vector drawing software extended with the Bar Graphs Solution from the Graphs and Charts area of ConceptDraw Solition Park.Drawing Illustration
The Nature Solution addition to ConceptDraw Solution Park for ConceptDraw PRO includes new libraries that provide a wide range nature objects and it can be used in many areas.Beauty in nature Illustrations and Clipart
Nature solution expands our software possibilities to create beautiful illustrations and cliparts with the new library which contains 17 vector objects.SSADM Diagram
The vector stencils library SSADM from the solution Systems engineering contains specific symbols of SSADM diagrams for ConceptDraw PRO diagramming and vector drawing software. The Systems engineering solution is contained in Software Development area of ConceptDraw Solution Park.The example below illustrates the waterfall model used in SSADM. This model involves 5 stages of developing a product such as requirements specification and its' analysis, design, coding and testing.
HelpDesk
How to Add a Fishbone Diagram to PowerPoint Presentation
Fishbone (Ishikawa) diagram is often used in business to determine the cause of some problems. The easiest way to draw a Fishbone diagram is using ConceptDraw Fishbone Diagram solution.Formalization and Verification of Event-driven Process chain
EPC or The Event - driven Process Chain diagrams that provide Enterprise Resource Planning improvement.ConceptDraw PRO - software that reduces the time needed to create a business process model.
- Draw An Event Diagram To Illustrate Relationship Among Event
- Aerospace and Transport | Event -driven Process Chain Diagrams ...
- UML Collaboration Diagram (UML2.0) | Event -driven Process Chain ...
- Business process Flow Chart - Event -Driven Process chain (EPC ...
- Process Flowchart | Event -driven Process Chain Diagrams | Basic ...
- Pyramid Chart Examples | Bar Diagrams for Problem Solving ...
- Draw A Diagram That Illustrate The Chain Of A Customer Service
- Business process Flow Chart
- Rail transport - Design elements | Subway Train Map | Event -driven ...
- Event -driven Process Chain Diagrams | Process Flowchart ...
- Business process Flow Chart - Event -Driven Process chain (EPC ...
- Draw A Diagram That Illustrate The Chain Of Customer Service
- Example of DFD for Online Store (Data Flow Diagram ) DFD ...
- Sample Organizational Chart Of An Event Management Company
- Business process Flow Chart - Event -Driven Process chain (EPC ...
- UML Composite Structure Diagram | Event -driven Process Chain ...
- Business process Flow Chart - Event -Driven Process chain (EPC ...
- Bar Diagrams for Problem Solving. Create event management bar ...
- Waterfall Model Of Event Management
- Er Diagram For Event Management
- ERD | Entity Relationship Diagrams, ERD Software for Mac and Win
- Flowchart | Basic Flowchart Symbols and Meaning
- Flowchart | Flowchart Design - Symbols, Shapes, Stencils and Icons
- Flowchart | Flow Chart Symbols
- Electrical | Electrical Drawing - Wiring and Circuits Schematics
- Flowchart | Common Flowchart Symbols
- Flowchart | Common Flowchart Symbols


