UML Use Case Diagram Example. Registration System

This sample was created in ConceptDraw DIAGRAM diagramming and vector drawing software using the UML Use Case Diagram library of the Rapid UML Solution from the Software Development area of ConceptDraw Solution Park.
This sample shows the types of user’s interactions with the system and is used at the registration and working with the database system.
This example of bank ATM UML activity diagram was created on the base of UML use case diagram of automated teller machine from the course "Thinking in Java, 2nd edition, Revision 9" by Bruce Eckel published on the website of the Computer Science and Electrical Engineering Department of the University of Maryland, Baltimore (UMBC).
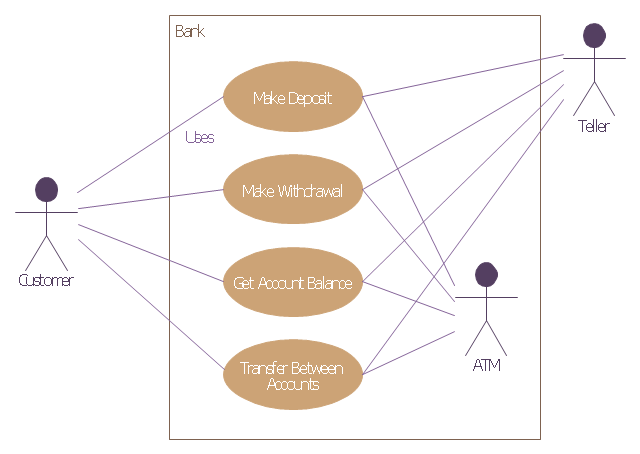
"If you are designing an auto-teller, for example, the use case for a particular aspect of the functionality of the system is able to describe what the auto-teller does in every possible situation. Each of these “situations” is referred to as a scenario, and a use case can be considered a collection of scenarios. You can think of a scenario as a question that starts with: “What does the system do if...?” For example, “What does the auto-teller do if a customer has just deposited a check within the last 24 hours, and there’s not enough in the account without the check having cleared to provide a desired withdrawal?”
Use case diagrams are intentionally simple to prevent you from getting bogged down in system implementation details prematurely...
Each stick person represents an “actor,” which is typically a human or some other kind of free agent. (These can even be other computer systems, as is the case with “ATM.”) The box represents the boundary of your system. The ellipses represent the use cases, which are descriptions of valuable work that can be performed with the system. The lines between the actors and the use cases represent the interactions.
It doesn’t matter how the system is actually implemented, as long as it looks like this to the user."
[csee.umbc.edu/ courses/ 331/ resources/ tij/ text/ TIJ213.gif]
This automated teller machine (ATM) UML use case diagram example was created using the ConceptDraw PRO diagramming and vector drawing software extended with the ATM UML Diagrams solution from the Software Development area of ConceptDraw Solution Park.
Bank ATM UML sequence diagram
Block Diagram

Use the libraries from the Block Diagrams solution to draw block diagrams for your business documents, presentations and websites in a few minutes.
Cross-Functional Flowchart

Use cross-functional flowcharts to show the relationship between a business process and the functional units (such as departments) responsible for that process. To create it use the best flowchart maker of ConceptDraw DIAGRAM.

 Business Process Workflow Diagrams
The Business Process Workflow Diagrams solution enhances the ConceptDraw DIAGRAM functionality with predesigned examples, samples and a numerous collection of predesigned vector objects of workflow chart elements, icons, arrows, connectors, and varied wor
 Security and Access Plans
The Security and Access Plans solution may be utilized in order to develop detailed equipment and cabling layout plans, blueprints, and wiring diagrams on internal and external security and access control systems, video surveillance and closed-circuit television (CCTV) systems. IT specialists, security managers, and other guards may use it to quickly design security plans and access plans, security chart, physical security plan, access chart, or access scheme on desire.
 Vehicular Networking
The Vehicular Networking solution extends the ConceptDraw DIAGRAM software functionality with specialized tools, wide variety of pre-made vector objects, collection of samples and templates in order to help network engineers design vehicular network diagrams for effective network engineering activity, visualize vehicular networks, develop smart transportation systems, design various types of vehicle network management diagrams, regional network diagrams, vehicular communication system diagrams, vehicular ad-hoc networks, vehicular delay-tolerant networks, and other network engineering schemes.
Business diagrams & Org Charts with ConceptDraw DIAGRAM


Examples of Flowcharts, Org Charts and More


 Fire and Emergency Plans
It's a good idea to have an emergency exit strategy in place for your home or business. ConceptDraw gives you the tools to create your own fire and emergency plan, tailored to your setting.
Fire and Emergency Plans
It's a good idea to have an emergency exit strategy in place for your home or business. ConceptDraw gives you the tools to create your own fire and emergency plan, tailored to your setting.
 People
This solution extends ConceptDraw DIAGRAM software with samples, templates and libraries of vector clipart for drawing the People illustrations. Use it to make professional-looking documents, presentations and websites illustrated with color scalable vector c
Organization Structure

 Business Diagrams
The Business Diagrams Solution extends ConceptDraw DIAGRAM with an extensive collection of professionally designed illustrative samples and a wide variety of vector stencils libraries, which are the real help for all business-related people, business analysts, business managers, business advisers, marketing experts, PR managers, knowledge workers, scientists, and other stakeholders allowing them to design the bright, neat, expressive and attractive Bubble Diagrams, Circle-Spoke Diagrams, Circular Arrows Diagrams, and Venn Diagrams with different quantity of sets in just minutes; and then successfully use them in documents, reports, statistical summaries, and presentations of any style.
 Picture Graphs
Typically, a Picture Graph has very broad usage. They many times used successfully in marketing, management, and manufacturing. The Picture Graphs Solution extends the capabilities of ConceptDraw DIAGRAM with templates, samples, and a library of professionally developed vector stencils for designing Picture Graphs.
 Business Diagrams Package
Business Diagrams Package is a large set of comprehensive graphical solutions from the ConceptDraw Solution Park, which are powerful in solving the business, marketing and quality tasks in completely different fields, such as finance, education, health food and cooking, HR, and many others. The tools of this package's solutions are a powerful assistant in drawing all diversity of Financial and Marketing infographics, Business process workflow diagrams, Organizational charts, Education infographics, Quality diagrams, Health food diagrams, HR flowcharts, as well as different graphics and charts, which depict the values of key business indicators, their dependencies, give the full understanding of a situation within a company and on the market.
Multi Layer Venn Diagram. Venn Diagram Example

- UML Diagram of Parking | State Machine Diagram | UML ...
- UML Diagram of Parking | UML Use Case Diagram Example. Social ...
- Define Create A Use Case Digram For University Mangement System
- UML Use Case Diagram Example Registration System
- Sequence Diagram For Car Parking System
- UML Diagram of Parking | UML Activity Diagram | UML Class ...
- UML Diagram of Parking | UML Activity Diagram | UML Use Case ...
- UML Diagram of Parking | UML Deployment Diagram Example ...
- UML use case diagram - Banking system | How to Create a Bank ...
- Bank ATM use case diagram | Bubble diagrams in Landscape ...
- Taxi Service Data Flow Diagram DFD Example | UML Use Case ...
- UML use case diagram - Project administrator
- Inter-vehicle communication systems | Global vehicular network ...
- Transport Management System For Usecase Diagram
- Use Case Diagrams technology with ConceptDraw PRO | UML use ...
- Taxi Service Data Flow Diagram DFD Example | UML Use Case ...
- ATM UML Diagrams | Bank Sequence Diagram | UML Use Case ...
- Diagram Of Car
- UML Use Case Diagram Example. Registration System | Financial ...
- Event-driven Process Chain Diagrams | Inter-vehicle communication ...
- ERD | Entity Relationship Diagrams, ERD Software for Mac and Win
- Flowchart | Basic Flowchart Symbols and Meaning
- Flowchart | Flowchart Design - Symbols, Shapes, Stencils and Icons
- Flowchart | Flow Chart Symbols
- Electrical | Electrical Drawing - Wiring and Circuits Schematics
- Flowchart | Common Flowchart Symbols
- Flowchart | Common Flowchart Symbols