"Product life cycle is a business analysis that attempts to identify a set of common stages in the life of commercial products. In other words the 'Product Life cycle' PLC is used to map the lifespan of the product such as the stages through which a product goes during its lifespan. ...
The stages of a product's life cycle... :
1. INTRODUCTION... 2. GROWTH... 3. MATURITY... 4. DECLINE...
The product life cycle is an important concept in marketing. It includes four stages that a product goes through from when it was first thought of until it is eliminated from the industry. Not all products reach this final stage. Some continue to grow and others rise and fall." [Product lifecycle. Wikipedia]
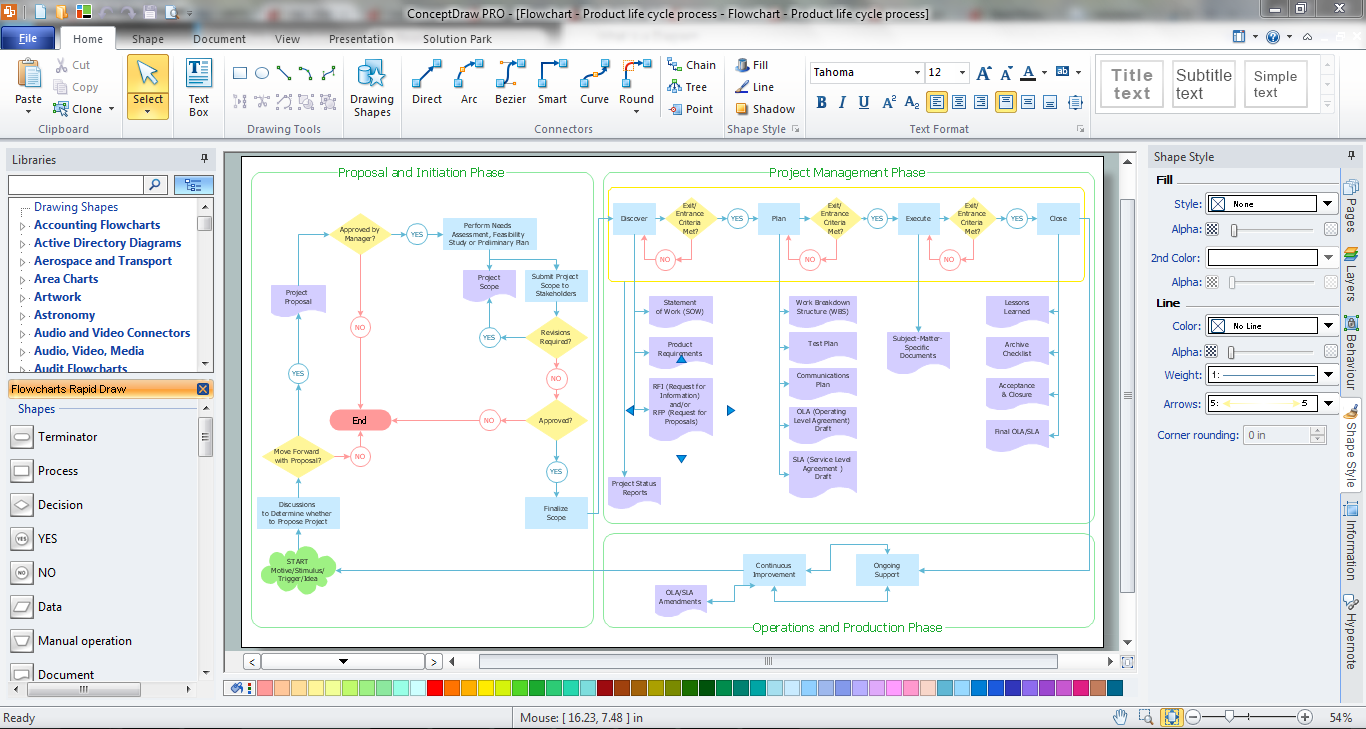
The flow chart example "Product life cycle process" was created using the ConceptDraw PRO diagramming and vector drawing software extended with the Flowcharts solution from the area "What is a Diagram" of ConceptDraw Solution Park.
The stages of a product's life cycle... :
1. INTRODUCTION... 2. GROWTH... 3. MATURITY... 4. DECLINE...
The product life cycle is an important concept in marketing. It includes four stages that a product goes through from when it was first thought of until it is eliminated from the industry. Not all products reach this final stage. Some continue to grow and others rise and fall." [Product lifecycle. Wikipedia]
The flow chart example "Product life cycle process" was created using the ConceptDraw PRO diagramming and vector drawing software extended with the Flowcharts solution from the area "What is a Diagram" of ConceptDraw Solution Park.
Flowchart - Product life cycle process

Draw Flowcharts with ConceptDraw

Use the Best FlowChart Tool for the Job

Create Process Flowcharts

Good Flow Chart app for Mac

What is the Accounting Cycle?

 Flowcharts
The Flowcharts solution for ConceptDraw DIAGRAM is a comprehensive set of examples and samples in several varied color themes for professionals that need to represent graphically a process. Solution value is added by the basic flow chart template and shapes' libraries of flowchart notation. ConceptDraw DIAGRAM flow chart creator lets one depict the processes of any complexity and length, as well as design the Flowchart either vertically or horizontally.
Flow Chart Creator
The vector stencils library "Marketing diagrams" contains 12 templates of marketing and sales diagrams and charts. Use it to illustrate your marketing and sales documents, presentations, infographics and webpages in ConceptDraw PRO software extended with Marketing Diagrams solution from Marketing area of ConceptDraw Solution Park.
Diffusion of Innovations

Normal distribution

Five forces model

Leaky bucket diagram

Funnel diagram

Relationship ladder of customer loyalty

Six markets model

Product life cycle graph

Extended product life cycle graph

Service-goods continuum diagram

Step chart block

Step diagram block

Basic Diagramming


Create TQM Flowcharts for Mac
How to Build Cloud Computing Diagram Principal Cloud Manufacturing

For documenting the Cloud Computing Architecture with a goal to facilitate the communication between stakeholders are successfully used the Cloud Computing Architecture diagrams. It is convenient and easy to draw various Cloud Computing Architecture diagrams in ConceptDraw DIAGRAM software with help of tools of the Cloud Computing Diagrams Solution from the Computer and Networks Area of ConceptDraw Solution Park.
Marketing Charts

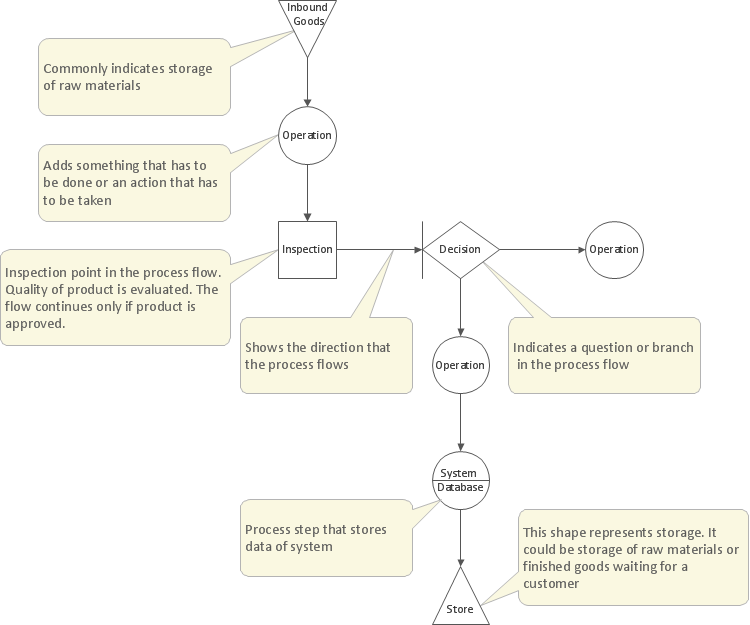
Flow Chart Symbols

Flowchart diagrams consists of symbols of process, decision, data and document, data base, termination or initiation processes, processing loops and conditions. To create an drawn flowchart use professional flowchart maker of ConceptDraw DIAGRAM.
- Product life cycle process - Flowchart | Draw Flowcharts with ...
- Draw And Label A Product Life Cycle Diagram
- Draw Flowcharts with ConceptDraw | Product life cycle graph ...
- Create A Product Life Cycle Graph
- Create Product Life Cycle Chart
- Draw Flowcharts with ConceptDraw | Product life cycle process ...
- Marketing Product Life Cycle Template
- Product Life Cycle Chart
- Product life cycle process - Flowchart | Product life cycle graph ...
- Product life cycle process - Flowchart | Sales Process Flowchart ...
- How To Draw Product Life Cycle Graph
- Product life cycle graph - Template
- Product life cycle graph
- Product Life Cycle Block Diagram
- Create Product Life Cycle Graph
- Product life cycle process - Flowchart | Process Flowchart | Sales ...
- Product Life Cycle Flow Chart
- Product life cycle process - Flowchart | Project management life ...
- Product life cycle process - Flowchart | Program to Make Flow Chart ...
- Flowchart - Product life cycle process | Product life cycle graph | Use
- ERD | Entity Relationship Diagrams, ERD Software for Mac and Win
- Flowchart | Basic Flowchart Symbols and Meaning
- Flowchart | Flowchart Design - Symbols, Shapes, Stencils and Icons
- Flowchart | Flow Chart Symbols
- Electrical | Electrical Drawing - Wiring and Circuits Schematics
- Flowchart | Common Flowchart Symbols
- Flowchart | Common Flowchart Symbols