How to Create a Line Chart

How to Create a Scatter Chart

HelpDesk
How to Draw a Line Chart Quickly

How to Create a Column Chart

How to Create a Bar Chart

HelpDesk
How to Create a Bar Chart in ConceptDraw PRO

Bar charts are widely used to show and compare the values of the same parameters for different data groups.
The bar graph can be vertical or horizontal. This depends on the amount of categories. There are many methods in which bar graph can be built and this makes it a very often used chart type. Usually, a bar chart is created so that the bars are placed vertically. Such arrangement means that the bar's height value is proportional to the category value. Nevertheless, a bar chart can be also drawn horizontally. This means that the longer the bar, the bigger the category. Thus, a bar chart is a good way to present the relative values of different measured items. The ConceptDraw Bar Graphs solution allows you to draw a bar chart quickly using a vector library, containing the set of various bar charts objects.
HelpDesk
How to Create Management Infographics Using ConceptDraw PRO

ConceptDraw PRO can be used as a tool for creating management infographics. It allows you to draw infographics quickly and easily using the special templates and vector stencils libraries. Infographics can be used to quickly communicate a message, to simplify the presentation of large amounts of data, to see data patterns and relationships, and to monitor changes in variables over time. It can contain bar graphs, pie charts, histograms, line charts, e.t.c.
HelpDesk
How to Draw a Pareto Chart Using ConceptDraw PRO

ConceptDraw Seven Basic Tools of Quality solution delivers a big set of vector stencil libraries and samples for each quality control diagram, including a Pareto chart.
HelpDesk
How to Connect Text Data to a Time Series Chart on Your Live Dashboard


HelpDesk
How to Make a Logistic Dashboard

 Physics
Physics solution extends ConceptDraw PRO software with templates, samples and libraries of vector stencils for drawing the physical illustrations, diagrams and charts.
Typography Infographic Software

Use the Typography Infographics Solution for ConceptDraw PRO typography infographic software to create your own professional looking Typography Infographics of any complexity quick, easy and effective, and then successfully use them in various fields.
HelpDesk
How to Draw Physics Diagrams in ConceptDraw PRO
")
Typography Art

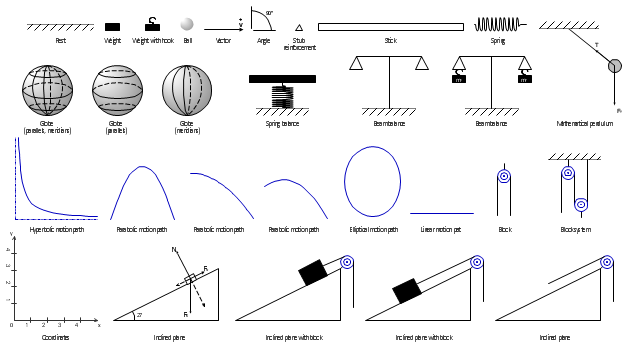
The vector stencils library "Mechanics" contains 29 symbol shapes for drawing mechanics experiment schemes and physical diagrams.
"Mechanics ... is the branch of science concerned with the behavior of physical bodies when subjected to forces or displacements, and the subsequent effects of the bodies on their environment. The scientific discipline has its origins in Ancient Greece with the writings of Aristotle and Archimedes. During the early modern period, scientists such as Galileo, Kepler, and especially Newton, laid the foundation for what is now known as classical mechanics. It is a branch of classical physics that deals with particles that are either at rest or are moving with velocities significantly less than the speed of light. It can also be defined as a branch of science which deals with the motion of and forces on objects." [Mechanics. Wikipedia]
The example "Design elements - Mechanics" was created using the ConceptDraw PRO diagramming and vector drawing software extended with the Physics solution from the Science and Education area of ConceptDraw Solution Park.
Mechanical symbols
- Design elements - Mechanics | Physics Diagrams | Organic ...
- How To Draw A Reflected Ceiling Plan
- How to Draw an Area Chart in ConceptDraw PRO | Area charts ...
- Line Chart Template for Word | Scatter graph - Template | Double ...
- Area chart - Template | Line Chart Template for Word | Gantt Chart ...
- Line Chart Template for Word | Chart Maker for Presentations | Chart ...
- Design elements - Area charts | Area Charts | Basic Area Charts ...
- Design elements - Text blocks
- Free-body diagram | Physics Diagrams | How to Draw Physics ...
- How to Discover Critical Path on a Gantt Chart | Critical Path Method ...
- Chart Maker for Presentations | Serious crime in Cincinnati | Column ...
- Design elements - Text blocks | CMP adaptive management cycle ...
- How to Draw Geometric Shapes in ConceptDraw PRO ...
- Software For Drawing Mathematical Diagrams
- Mathematics Symbols | Mathematical Diagrams | Basic Flowchart ...
- Process Flow Chart Symbols | Physics Symbols | Workflow Diagram ...
- Double bar graph - Template
- How to Create a Hook Up Diagram | Audiovisual system hook up ...
- Double bar graph - Template
- How to Create Digital Media Infographics Using ConceptDraw PRO ...
- ERD | Entity Relationship Diagrams, ERD Software for Mac and Win
- Flowchart | Basic Flowchart Symbols and Meaning
- Flowchart | Flowchart Design - Symbols, Shapes, Stencils and Icons
- Flowchart | Flow Chart Symbols
- Electrical | Electrical Drawing - Wiring and Circuits Schematics
- Flowchart | Common Flowchart Symbols
- Flowchart | Common Flowchart Symbols