UML Deployment Diagram. Design Elements
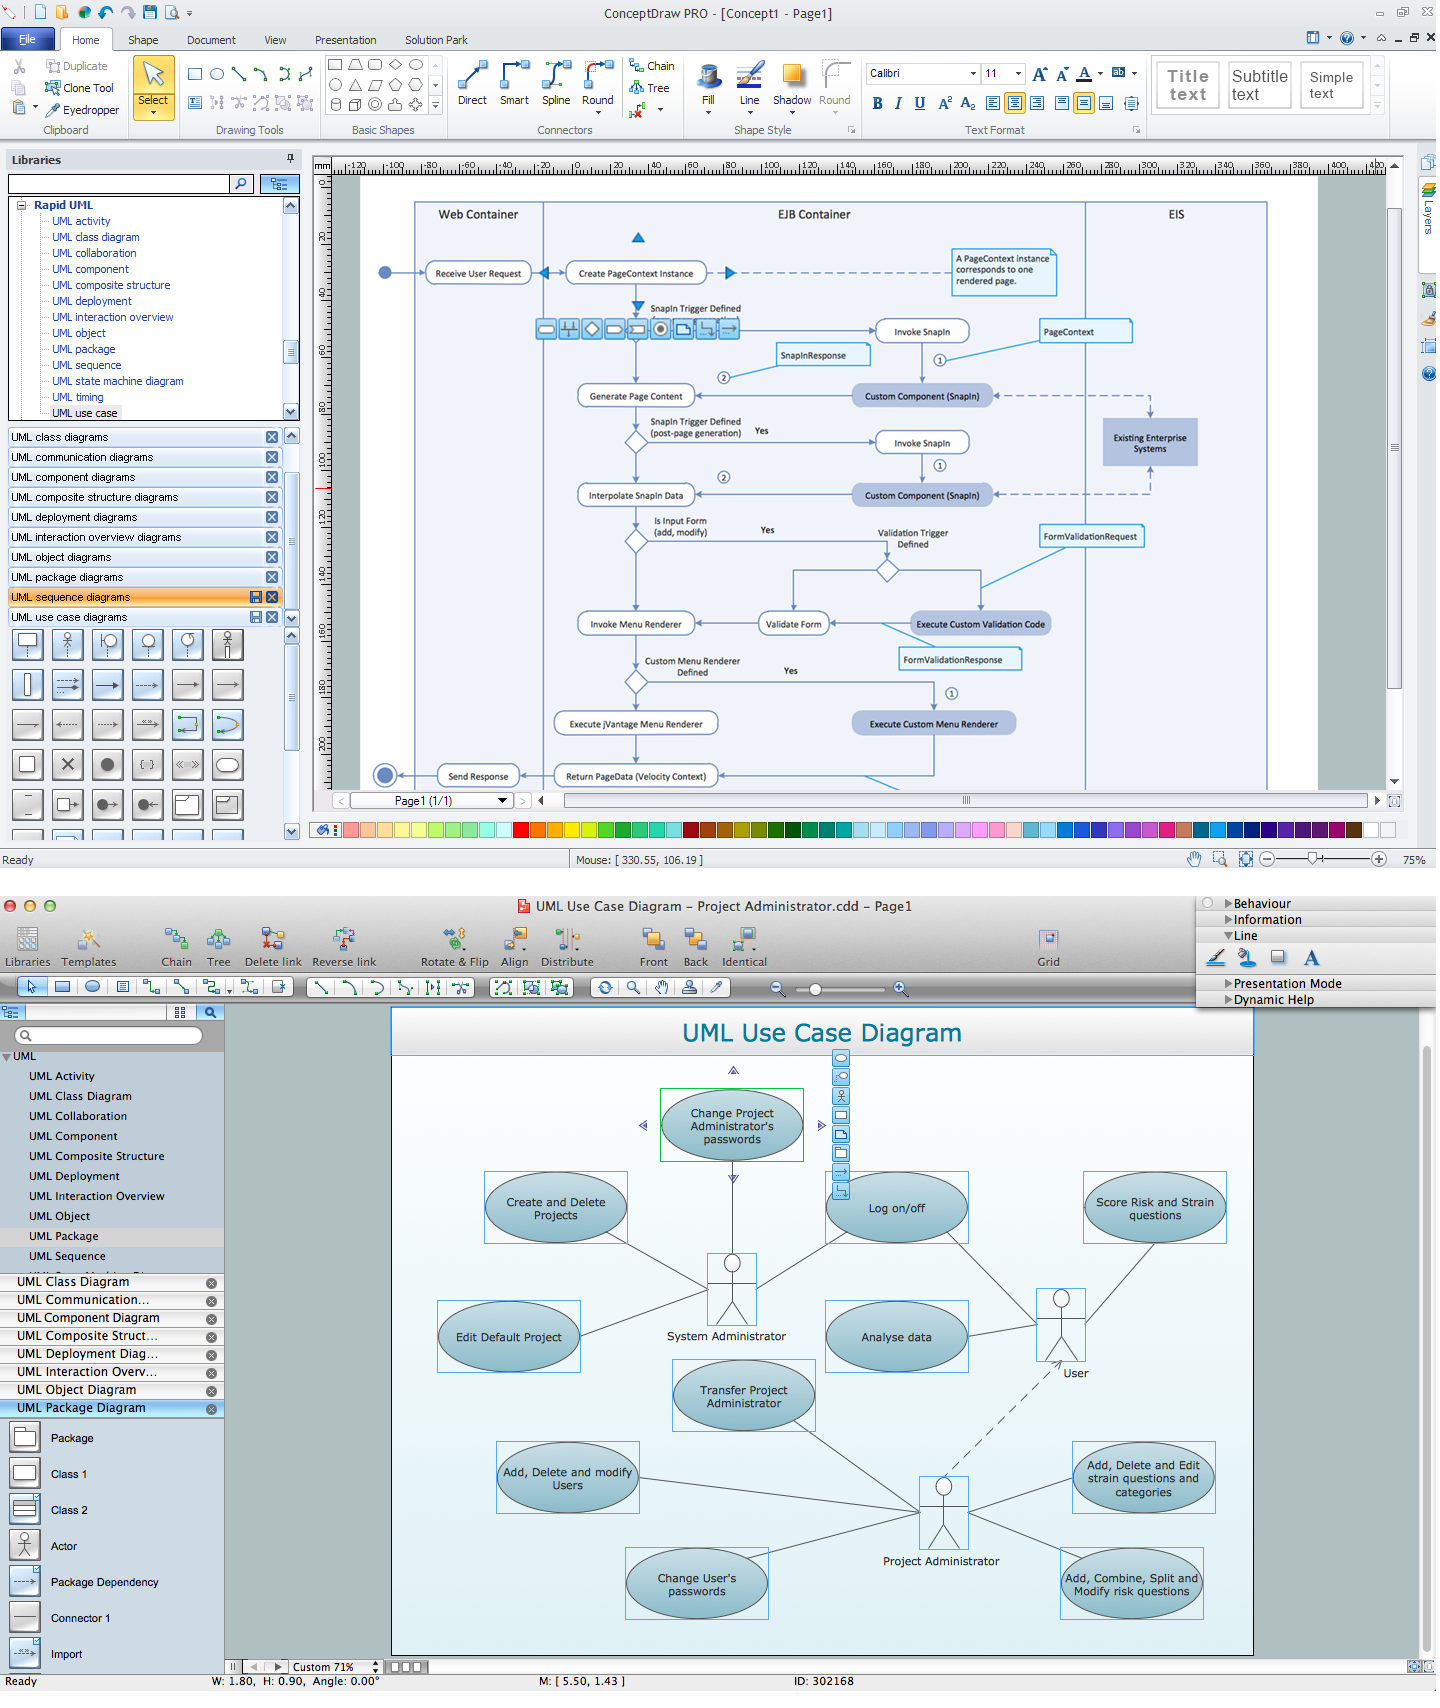
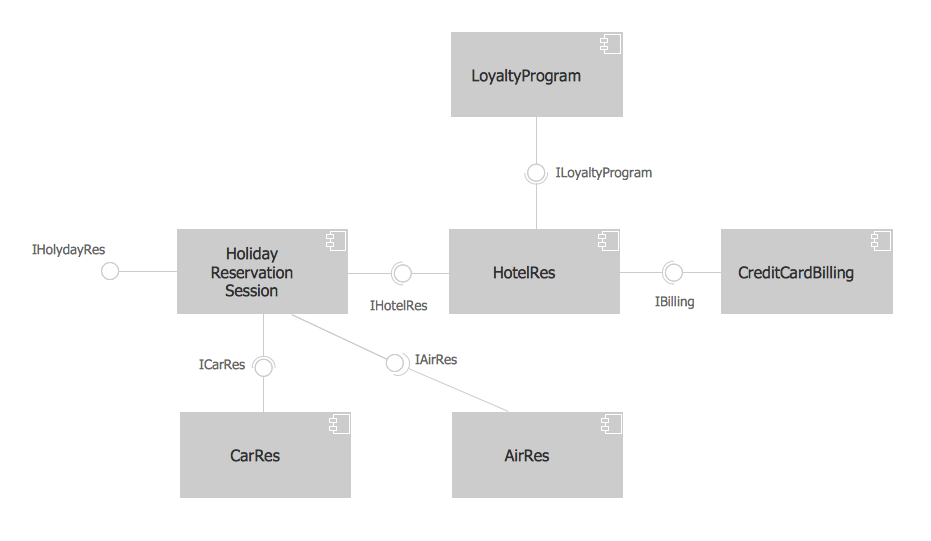
UML Deployment diagram describes the hardware used in system implementations and the execution environments and artifacts deployed on the hardware.ConceptDraw has 393 vector stencils in the 13 libraries that helps you to start using software for designing your own UML Diagrams. You can use the appropriate stencils of UML notation from UML Deployment library.
UML Diagramming Software
The UML Diagrams are widely used by software developers and software engineers. They can draw the UML Diagrams manually on the paper, but it is incredibly convenient to use the special UML diagramming software. The UML diagramming software allows you to draw the UML Diagrams in a few minutes.UML Diagram Types List
Two types of diagrams are used in UML: Structure Diagrams and Behavior Diagrams. Behavior Diagrams represent the processes proceeding in a modeled environment. Structure Diagrams represent the elements that compose the system.Venn Diagram Examples for Problem Solving. Environmental Social Science. Human Sustainability Confluence
The Venn diagram example below shows sustainable development at the confluence of three constituent parts.Create your Venn diagrams for problem solving in environmental social science using the ConceptDraw PRO diagramming and vector drawing software extended with the Venn Diagrams solution from the area "Diagrams" of ConceptDraw Solution Park.
HelpDesk
Accounting Information Systems Flowchart Symbols
Accounting Information system is a combination of software and hardware, as well as organizational support. Information system - it is not only the software and computers with network equipment, but also a list of instructions and standards which can be notated using Accounting information systems flowchart symbols. All information systems can be divided into information retrieval and data processing systems. Data Flow model is a hierarchical model. Each process can be divided into structural components, that depict by corresponding flowchart symbols, showing the accounting information system in communication with the external environment. The major components of accounting information systems flowchart are: entities, processes, data stores, and data flows. The set of standard accounting information flowchart symbols is intended to show the relationships between the system components. ConceptDraw PRO can help to draw clear accounting information system diagrams using special flowchart symbols.Simple Drawing Applications for Mac
ConceptDraw gives the ability to draw simple diagrams like flowcharts, block diagrams, bar charts, histograms, pie charts, divided bar diagrams, line graphs, area charts, scatter plots, circular arrows diagrams, Venn diagrams, bubble diagrams, concept maps, and others.Network Diagram Software LAN Network Diagrams & Diagrams for LAN Physical Office Network Diagrams
ConceptDraw - Perfect Network Diagramming Software with examples of WAN, LAN Diagrams. ConceptDraw Network Diagram is ideal for network engineers and network designers who need to draw Local Area Network diagrams, physical office network diagrams and Diagram for LAN.
Network Topologies
ConceptDraw PRO is a powerful Network Topology Diagram software thanks to the Computer Network Diagrams Solution from the Computer and Networks Area. It's very easy and quickly to design the network topologies diagrams of any kinds and complexity in ConceptDraw PRO diagramming and vector drawing software.Easy to draw network topology, physical network, logical network, network mapping, home area networks (HAN), wireless network, cisco network topologies, fully connected network topology, bus network topology, star network topology, ring network topology, mesh network topology, tree network topology.

DFD Library System
Use the Data Flow Diagrams solution from the Software Development area of ConceptDraw Solution Park to draw your own context-level DFDs using the ConceptDraw PRO diagramming and vector drawing software.Fishbone Diagram Template
A causal model is an abstract concept, that describes the causal mechanisms of a system, by noting certain variables and their influence on each other, in an effort to discover the cause of a certain problem or flaw. This model is presented in diagram form by using a fishbone diagram.ConceptDraw PRO diagramming and vector drawing software enhanced with Fishbone Diagrams solution helps you create business productivity diagrams from Fishbone diagram templates and examples, that provide to start using of the graphic method for the analysis of problem causes. Each predesigned Fishbone Diagram template is ready to use and useful for instantly drawing your own Fishbone Diagram.
In searching of alternative to MS Visio for MAC and PC with ConceptDraw PRO
Many of us are acquainted with such a software product as MS Visio, which beyond any doubt, is a powerful and multifunctional tool. However, there may occur instances when this program turns incapable of meeting certain users' requirements; and then, the most optimum solution is quite difficult to find. But there is always an alternative. ConceptDraw PRO from CS Odessa Corporation has been developed to satisfy all your needs as an alternative product to Visio.Visio for mac — ConceptDraw as an alternative to MS Visio. ConceptDraw has been developed to satisfy all your needs as a fully-functioned alternative product to MS Visio for Mac.
About UML
Use Case Diagram Taxi Service UML. This sample was created in ConceptDraw PRO diagramming and vector drawing software using the UML Use Case Diagram library of the Rapid UML Solution from the Software Development area of ConceptDraw Solution Park.This sample shows the work of the taxi service and is used by taxi stations, by airports, in the tourism field and delivery service.
Object-Oriented Development (OOD) Method
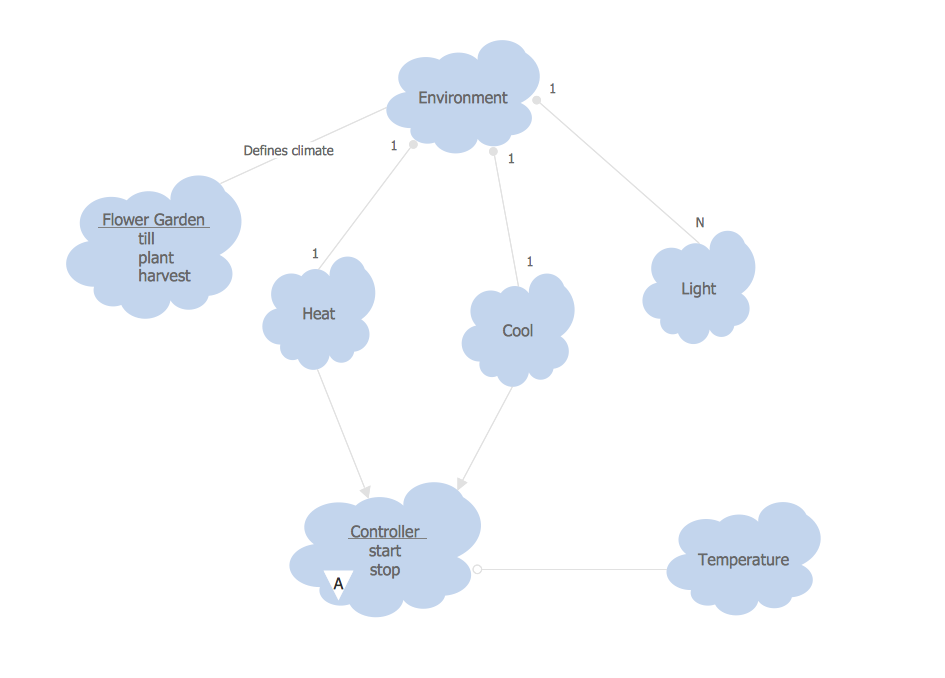
This sample shows the Booch OOD diagram of the environment. The Booch method (developed by Grady Booch) is an object modeling language and methodology used in software engineering.This sample was created in ConceptDraw PRO diagramming and vector drawing software using the Rapid UML Solution from the Software Development area of ConceptDraw Solution Park.
Types of Flowcharts
A Flowchart is a graphically representation of the process, algorithm or the step-by-step solution of the problem. There are ten types of Flowcharts. Using the Flowcharts solution from the Diagrams area of ConceptDraw Solution Park you can easy and quickly design the Flowchart of any of these types.
- Drawing A Diagram Of Business Environment That Show All The ...
- Draw A Diagram Of Business Environment That Show All The Element
- Draw The Diagram Of Business Environment
- Draw Diagram Of Business Environment That Show All The Elements
- Draw A Diagram Of Business Environment That Shows All The ...
- Diagram Of Business Environment That Shows All The Elements
- Types Of Information System In Diagram
- Draw A Diagram Of Business Enviroment That Shows All The Element
- Business Environment Drawing
- Draw The Diagram Of Micro Business Environment
- Marketing Environment Flow Charts
- Draw Th Diagram Of Business Enironment
- Fishbone Diagram Environment
- Manufacturing 8 Ms fishbone diagram - Template | Data Flow ...
- What Is Diagram Business Enviroment Show All Element
- Business Productivity Diagramming | Ishikawa Diagram | Total ...
- Business Environment Swot Analysis
- Draw A Diagram Of Marketing Environment
- UML Activity Diagram | Business Productivity Diagramming | UML ...
- Diagramming Software for Design UML Object Diagrams | UML ...
- ERD | Entity Relationship Diagrams, ERD Software for Mac and Win
- Flowchart | Basic Flowchart Symbols and Meaning
- Flowchart | Flowchart Design - Symbols, Shapes, Stencils and Icons
- Flowchart | Flow Chart Symbols
- Electrical | Electrical Drawing - Wiring and Circuits Schematics
- Flowchart | Common Flowchart Symbols
- Flowchart | Common Flowchart Symbols


