Donut Chart Templates

All these donut chart templates are included in the Pie Charts solution.
You can quickly rework these examples into your own charts by simply changing displayed data, title and legend texts.
Pie Chart Software

ConceptDraw DIAGRAM software with Pie Charts solution helps to create pie and donut charts for effective displaying proportions in statistics, business and mass media for composition comparison, i.e. for visualization of part percentage inside one total.
Use this donut (doughnut) chart template in the ConceptDraw PRO diagramming and vector drawing software to visualize percentage of parts of one total.
"A doughnut chart (also spelled donut) is functionally identical to a pie chart, with the exception of a blank center and the ability to support multiple statistics as one." [Pie chart. Wikipedia]
The template "Doughnut chart" is included in the Pie Charts solution of the Graphs and Charts area in ConceptDraw Solution Park.
Donut chart
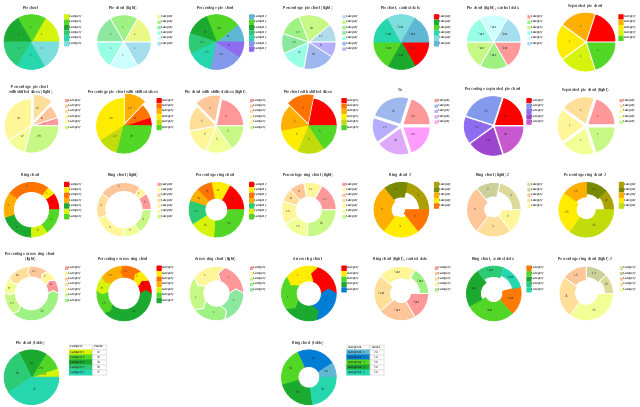
The vector stencils library "Pie charts" contains 30 templates of pie and donut (doughnut, ring) charts for visualizing percentage for parts of one total, or compare parts of few totals.
Drag a template from the library into your document and enter your data.
Use these shapes to draw your pie charts and donut charts in the ConceptDraw PRO diagramming and vector drawing software.
The vector stencils library "Pie charts" is included in the Pie Charts solution of the Graphs and Charts area in ConceptDraw Solution Park.
Pie chart (table)
-pie-charts---vector-stencils-library.png--diagram-flowchart-example.png)
Pie chart

Percentage pie chart

Pie chart, control dots

Separated pie chart

Percentage separated pie chart

Pie chart with shifted slices

Percentage pie chart with shifted slices

Ring chart (table)
-pie-charts---vector-stencils-library.png--diagram-flowchart-example.png)
Ring chart

Percentage ring chart

Ring chart 2

Percentage ring chart 2

Ring chart, control dots

Arrow ring chart
Percentage arrow ring chart
Pie chart (light)
-pie-charts---vector-stencils-library.png--diagram-flowchart-example.png)
Percentage pie chart (light)
-pie-charts---vector-stencils-library.png--diagram-flowchart-example.png)
Pie chart (light), control dots
,-control-dots-pie-charts---vector-stencils-library.png--diagram-flowchart-example.png)
Separated pie chart (light)
-pie-charts---vector-stencils-library.png--diagram-flowchart-example.png)
Percentage separated pie chart (light)
-pie-charts---vector-stencils-library.png--diagram-flowchart-example.png)
Pie chart with shifted slices (light)
-pie-charts---vector-stencils-library.png--diagram-flowchart-example.png)
Percentage pie chart with shifted slices (light)
-pie-charts---vector-stencils-library.png--diagram-flowchart-example.png)
Ring chart (light)
-pie-charts---vector-stencils-library.png--diagram-flowchart-example.png)
Percentage ring chart (light)
-pie-charts---vector-stencils-library.png--diagram-flowchart-example.png)
Ring chart (light) 2
-2-pie-charts---vector-stencils-library.png--diagram-flowchart-example.png)
Percentage ring chart (light) 2
-2-pie-charts---vector-stencils-library.png--diagram-flowchart-example.png)
Ring chart (light), control dots
,-control-dots-pie-charts---vector-stencils-library.png--diagram-flowchart-example.png)
Arrow ring chart (light)
Percentage arrow ring chart (light)
 Basic Pie Charts
This solution extends the capabilities of ConceptDraw DIAGRAM (or later) with templates, samples, and a library of vector stencils for drawing pie and donut charts.
 Pie Charts
Pie Charts are extensively used in statistics and business for explaining data and work results, in mass media for comparison (i.e. to visualize the percentage for the parts of one total), and in many other fields. The Pie Charts solution for ConceptDraw DIAGRAM offers powerful drawing tools, varied templates, samples, and a library of vector stencils for simple construction and design of Pie Charts, Donut Chart, and Pie Graph Worksheets.
The vector stencils library "Circular arrows diagrams" contains 20 templates of circular arrows diagrams and arrow donut charts.
Use these shapes to draw your circular arrows diagrams in the ConceptDraw PRO diagramming and vector drawing software.
The vector stencils library "Circular arrows diagrams" is included in the Circular Arrows Diagrams solution from the area "What is a Diagram" of ConceptDraw Solution Park.
Use these shapes to draw your circular arrows diagrams in the ConceptDraw PRO diagramming and vector drawing software.
The vector stencils library "Circular arrows diagrams" is included in the Circular Arrows Diagrams solution from the area "What is a Diagram" of ConceptDraw Solution Park.
Circular arrows diagram - 3 elements

Circular arrows diagram - 4 elements

Circular arrows diagram - 5 elements

Circular arrows diagram - 6 elements

Circular arrows diagram - 7 elements

Arrows donut chart - 3 slices

Arrows donut chart - 4 slices

Arrows donut chart - 5 slices

Arrows donut chart - 6 slices

Arrows donut chart - 7 slices

Ring chart - 3 elements

Ring chart - 4 elements

Ring chart - 5 elements

Ring chart - 6 elements

Ring chart - 7 elements

Arrow circle diagram - 3 elements
Arrow circle diagram - 4 elements
Arrow circle diagram - 5 elements
Arrow circle diagram - 6 elements
Arrow circle diagram - 7 elements
The vector stencils library Pie charts contains 30 templates you can use to add pie and donut charts in your business documents, presentation slides and infographics using the ConceptDraw PRO diagramming and vector drawing software.
"A pie chart (or a circle graph) is a circular chart divided into sectors, illustrating numerical proportion. In a pie chart, the arc length of each sector (and consequently its central angle and area), is proportional to the quantity it represents. While it is named for its resemblance to a pie which has been sliced, there are variations on the way it can be presented. ...
Pie charts are very widely used in the business world and the mass media. However, they have been criticized, and many experts recommend avoiding them, pointing out that research has shown it is difficult to compare different sections of a given pie chart, or to compare data across different pie charts. Pie charts can be replaced in most cases by other plots such as the bar chart. ...
However, if the goal is to compare a given category (a slice of the pie) with the total (the whole pie) in a single chart and the multiple is close to 25 or 50 percent, then a pie chart can often be more effective than a bar graph. ...
A doughnut chart (also spelled donut) is functionally identical to a pie chart, with the exception of a blank center and the ability to support multiple statistics as one." [Pie chart. Wikipedia]
The example "Design elements - Pie charts" is included in the Pie Charts solution of the Graphs and Charts area in ConceptDraw Solution Park.
Templates
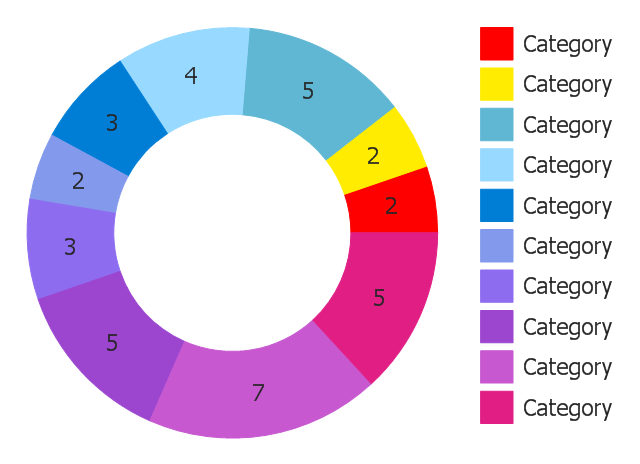
You can use this ring chart template in the ConceptDraw PRO diagramming and vector drawing software to add ring (doughnut, donut) charts to your websites, business documents, presentation slides and infographics.
"A doughnut chart (also spelled donut) is functionally identical to a pie chart, with the exception of a blank center and the ability to support multiple statistics as one." [Pie chart. Wikipedia]
The template "Ring chart" is included in the Pie Charts solution of the Graphs and Charts area in ConceptDraw Solution Park.
Donut chart
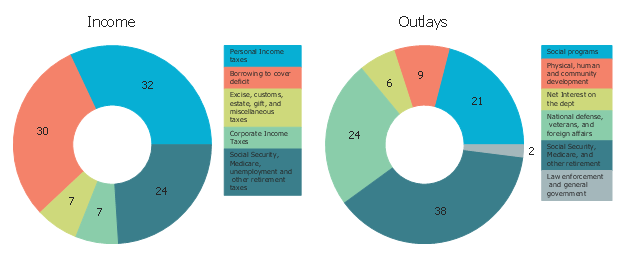
These doughnut charts show the relative sizes of the major categories of the federal income and outlays for fiscal year 2012. It was designed on the base of the pie charts from the website of the Internal Revenue Service (IRS), U.S. Department of the Treasury.
[apps.irs.gov/ app/ understandingTaxes/ whys/ thm01/ les01/ ac3_ thm01_ les01.jsp]
"An income tax is a tax imposed on individuals or entities (taxpayers) that varies with the income or profits (taxable income) of the taxpayer. Details vary widely by jurisdiction. Many jurisdictions refer to income tax on business entities as companies tax or corporate tax. Partnerships generally are not taxed; rather, the partners are taxed on their share of partnership items. Tax may be imposed by both a country and subdivisions. Most jurisdictions exempt locally organized charitable organizations from tax." [Income tax. Wikipedia]
The donut charts example "Income and outlays" was created using the ConceptDraw PRO diagramming and vector drawing software extended with the Pie Charts solution of the Graphs and Charts area in ConceptDraw Solution Park.
Donut chart
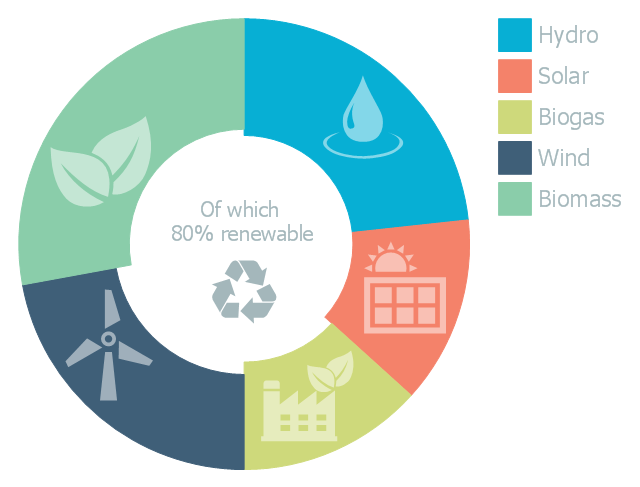
This doughnut chart sample illustrates the renewable energy sources. It was designed on the base of the Wikipedia file: Example of a doughnut chart.png.
[en.wikipedia.org/ wiki/ File:Example_ of_ a_ doughnut_ chart.png]
This file is licensed under the Creative Commons Attribution-ShareAlike 3.0 License. [creativecommons.org/ licenses/ by-sa/ 3.0/ ]
"Renewable energy is generally defined as energy that is collected from resources which are naturally replenished on a human timescale, such as sunlight, wind, rain, tides, waves, and geothermal heat. Renewable energy often provides energy in four important areas: electricity generation, air and water heating/ cooling, transportation, and rural (off-grid) energy services." [Renewable energy. Wikipedia]
The donut chart example "Renewable energy" was created using the ConceptDraw PRO diagramming and vector drawing software extended with the Pie Charts solutiton of the Graphs and Charts area in ConceptDraw Solution Park.
Donut chart
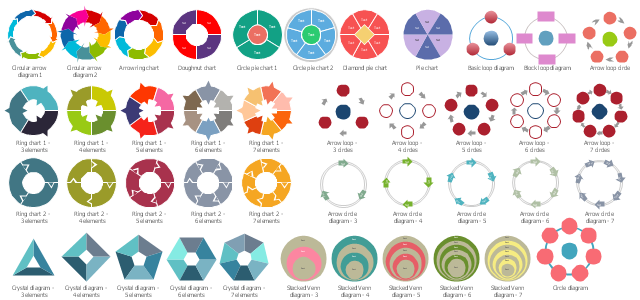
The vector stencils library "Circular diagrams" contains 42 templates of circular diagrams: circular arrow diagram, circular motion diagram, arrow ring chart, doughnut chart (donut chart), circle pie chart, diamond pie chart, circle diagram, pie chart, ring chart, loop diagram, block loop diagram, arrow loop circle, crystal diagram, triangular diagram, diamond diagram, pentagon diagram, hexagon diagram, heptagon diagram, cycle diagram (cycle chart), stacked Venn diagram (onion diagram), arrow circle diagram.
Use these shapes to illustrate your marketing and sales documents, presentations, webpages and infographics in the ConceptDraw PRO diagramming and vector drawing software extended with the Target and Circular Diagrams solution from the Marketing area of ConceptDraw Solution Park.
www.conceptdraw.com/ solution-park/ marketing-target-and-circular-diagrams
Circular arrow diagram 1
Circular arrow diagram 2
Arrow ring chart
Doughnut chart

Diamond pie chart

Pie chart

Circle diagram

Circle pie chart 2

Circle pie chart 1

Ring chart 1 - 3 elements

Ring chart 1 - 4 elements

Ring chart 1 - 5 elements

Ring chart 1 - 6 elements

Ring chart 1 - 7 elements

Ring chart 2 - 3 elements

Ring chart 2 - 4 elements

Ring chart 2 - 5 elements

Ring chart 2 - 6 elements

Ring chart 2 - 7 elements

Crystal diagram - 3 elements

Crystal diagram - 4 elements

Crystal diagram - 5 elements

Crystal diagram - 6 elements

Crystal diagram - 7 elements

Stacked Venn diagram - 4

Stacked Venn diagram - 5

Stacked Venn diagram - 6

Stacked Venn diagram - 7

Basic loop diagram

Block loop diagram

Arrow loop circle
Arrow loop - 3 circles
Arrow loop - 4 circles
Arrow loop - 5 circles
Arrow loop - 6 circles
Arrow loop - 7 circles
Arrow circle diagram - 3
Arrow circle diagram - 4
Stacked Venn diagram - 3

Arrow circle diagram - 5
Arrow circle diagram - 6
Arrow circle diagram - 7
The vector stencils library "Circular diagrams" contains 42 templates of circular diagrams: circular arrow diagram, circular motion diagram, arrow ring chart, doughnut chart (donut chart), circle pie chart, diamond pie chart, circle diagram, pie chart, ring chart, loop diagram, block loop diagram, arrow loop circle, crystal diagram, triangular diagram, diamond diagram, pentagon diagram, hexagon diagram, heptagon diagram, cycle diagram (cycle chart), stacked Venn diagram (onion diagram), arrow circle diagram.
Use these shapes to illustrate your marketing and sales documents, presentations, webpages and infographics in the ConceptDraw PRO diagramming and vector drawing software extended with the Target and Circular Diagrams solution from the Marketing area of ConceptDraw Solution Park.
www.conceptdraw.com/ solution-park/ marketing-target-and-circular-diagrams
Use these shapes to illustrate your marketing and sales documents, presentations, webpages and infographics in the ConceptDraw PRO diagramming and vector drawing software extended with the Target and Circular Diagrams solution from the Marketing area of ConceptDraw Solution Park.
www.conceptdraw.com/ solution-park/ marketing-target-and-circular-diagrams
Circular arrow diagram 1
Circular arrow diagram 2
Arrow ring chart
Doughnut chart
Diamond pie chart
Pie chart
Circle diagram
Circle pie chart 2
Circle pie chart 1
Ring chart 1 - 3 elements
Ring chart 1 - 4 elements
Ring chart 1 - 5 elements
Ring chart 1 - 6 elements
Ring chart 1 - 7 elements
Ring chart 2 - 3 elements
Ring chart 2 - 4 elements
Ring chart 2 - 5 elements
Ring chart 2 - 6 elements
Ring chart 2 - 7 elements
Crystal diagram - 3 elements
Crystal diagram - 4 elements
Crystal diagram - 5 elements
Crystal diagram - 6 elements
Crystal diagram - 7 elements
Stacked Venn diagram - 4
Stacked Venn diagram - 5
Stacked Venn diagram - 6
Stacked Venn diagram - 7
Basic loop diagram
Block loop diagram
Arrow loop circle
Arrow loop - 3 circles
Arrow loop - 4 circles
Arrow loop - 5 circles
Arrow loop - 6 circles
Arrow loop - 7 circles
Arrow circle diagram - 3
Arrow circle diagram - 4
Stacked Venn diagram - 3
Arrow circle diagram - 5
Arrow circle diagram - 6
Arrow circle diagram - 7
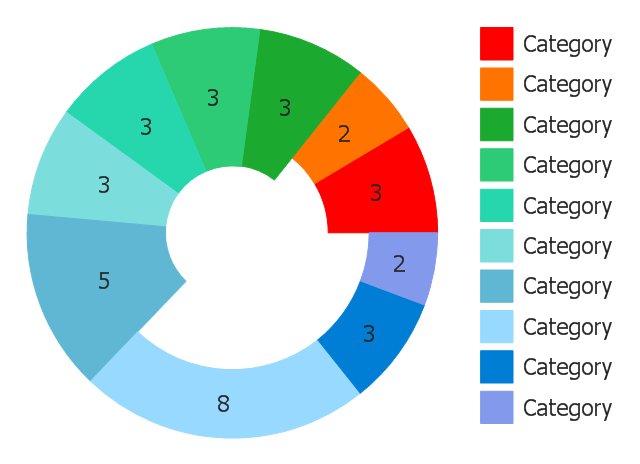
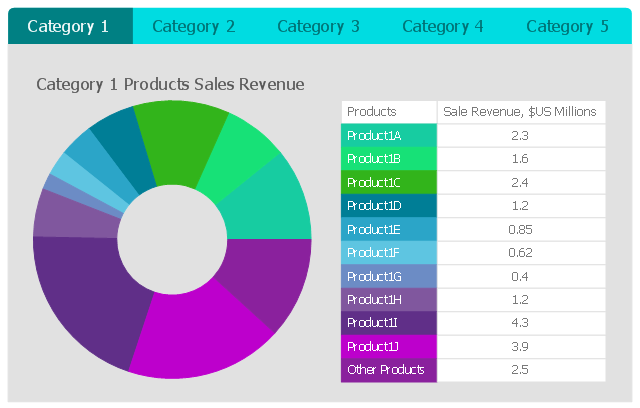
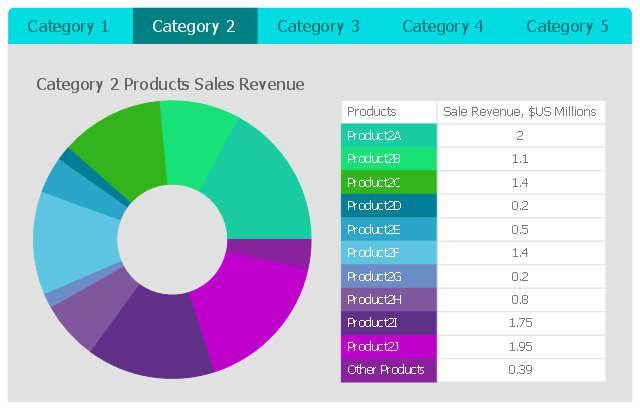
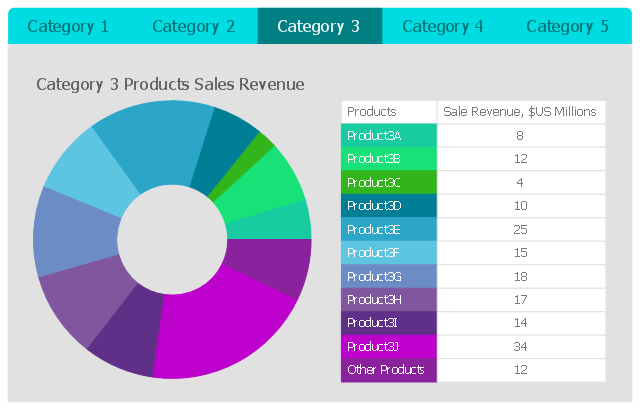
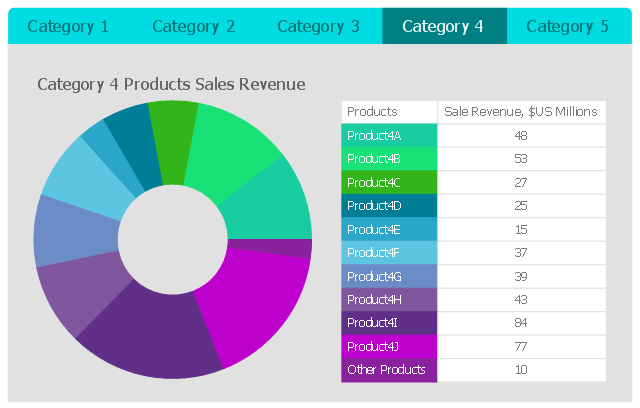
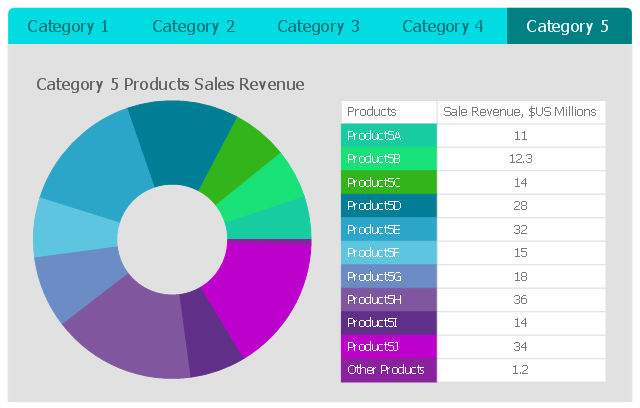
This business intelligence dashboard sample shows the quarter sales revenue for top 10 products by categories using donut charts.
"A doughnut chart (also spelled donut) is a variant of the pie chart, with a blank center allowing for additional information about the data as a whole to be included." [Pie chart. Wikipedia]
The BI dashboard example "Quarter Sales Revenue for Top 10 Products by Categories" was created using ConceptDraw PRO software extended with the Business Intelligence Dashboards solution from the Business Processes area of ConceptDraw Solution Park.
Category 1
Category 2
Category 3
Category 4
Category 5
This ring chart sample was redesigned from the Wikipedia file: Virtuous circle in management.svg.
"An example of the use of a virtuous circle in management."
[en.wikipedia.org/ wiki/ File:Virtuous_ circle_ in_ management.svg]
"A virtuous circle and a vicious circle (also referred to as virtuous cycle and vicious cycle) are economic terms. They refer to a complex chain of events that reinforces itself through a feedback loop. A virtuous circle has favorable results, while a vicious circle has detrimental results.
Both circles are complexes of events with no tendency towards equilibrium (at least in the short run). Both systems of events have feedback loops in which each iteration of the cycle reinforces the previous one (positive feedback). These cycles will continue in the direction of their momentum until an external factor intervenes and breaks the cycle. The prefix "hyper-" is sometimes used to describe these cycles if they are extreme. The best-known example of a vicious circle is hyperinflation. ...
Example in management.
Virtuous circle.
An employer's investment in his employees’ ability to provide superior service to customers can be seen as a virtuous circle. Effort spent in selecting and training employees and creating a corporate culture in which they are empowered can lead to increased employee satisfaction and employee competence. This can result in superior service delivery and customer satisfaction. This in turn will create customer loyalty, improved sales levels, and higher profit margins. Some of these profits can be reinvested in employee development, thereby initiating another iteration of a virtuous cycle." [en.wikipedia.org/ wiki/ Virtuous_ circle_ and_ vicious_ circle]
The ring chart example "Virtuous circle (management)" was created using the ConceptDraw PRO diagramming and vector drawing software extended with the Target and Circular Diagrams solution from the Marketing area of ConceptDraw Solution Park.
www.conceptdraw.com/ solution-park/ marketing-target-and-circular-diagrams
Ring chart
---ring-chart.png--diagram-flowchart-example.png)
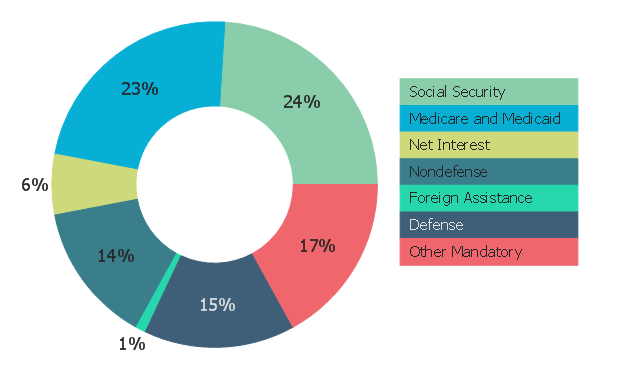
This doughnut chart sample shows the major categories of U.S. federal spending. It was designed on the base of the donut chart from the website ForeignAssistance.gov. [beta.foreignassistance.gov/ images/ learn/ FederalSpending_ piechart.png]
"The United States of America is a federal republic with separate state and local governments. Taxes are imposed in the United States at each of these levels. These include taxes on income, payroll, property, sales, capital gains, dividends, imports, estates and gifts, as well as various fees." [Taxation in the United States. Wikipedia]
The donut chart example "Major categories of federal spending" was created using the ConceptDraw PRO diagramming and vector drawing software extended with the Pie Charts solution of the Graphs and Charts area in
ConceptDraw Solution Park.
Donut chart
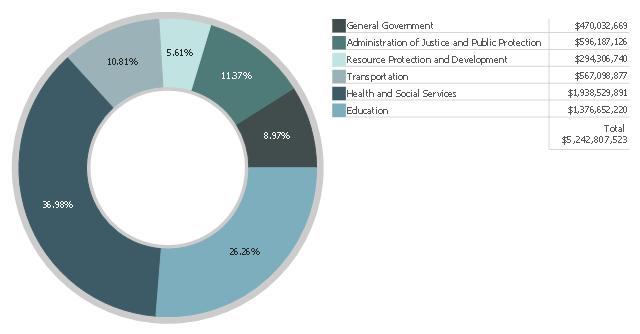
This donut chart example shows the citizens and taxpayers of New Hampshire how the State of New Hampshire spends their money they pay for their government. It depicts how the New Hampshire's FY2014 Authorized Budget as enacted is allocated to the six categories of government.
The doughnut chart example "Budgeted appropriations" was designed on the base of the graph from the official website of New Hampshire government. [www.nh.gov/ transparentnh/ where-the-money-goes/ ].
"Authorization and appropriations.
In general, funds for federal government programs must be authorized by an "authorizing committee" through enactment of legislation. Then, through subsequent acts by Congress, budget authority is then appropriated by the Appropriations Committee of the House. In principle, committees with jurisdiction to authorize programs make policy decisions, while the Appropriations Committees decide on funding levels, limited to a program's authorized funding level, though the amount may be any amount less than the limit.
The budget resolutions specify funding levels for the House and Senate Appropriations Committees and their 12 subcommittees, establishing various budget totals, allocations, entitlements, and may include reconciliation instructions to designated House or Senate committees. The appropriations committees, starting with allocations in the budget resolution, draft appropriations bills, which may be considered in the House after May 15. Once appropriations committees pass their bills, they are considered by the House and Senate. When there is a final budget, the spending available to each appropriations committee for the coming fiscal year is usually provided in the joint explanatory statement included in the conference report. The appropriations committees then allocate that amount among their respective subcommittees, each to allocate the funds they control among the programs within their jurisdiction." [United States budget process. Wikipedia]
The donut chart example "Budgeted appropriations" is created using the ConceptDraw PRO diagramming and vector drawing software extended with the Pie Charts solution of the Graphs and Charts area in ConceptDraw Solution Park.
Donut chart
The vector stencils library "Circular diagrams" contains 42 templates of circular diagrams: circular arrow diagram, circular motion diagram, arrow ring chart, doughnut chart (donut chart), circle pie chart, diamond pie chart, circle diagram, pie chart, ring chart, loop diagram, block loop diagram, arrow loop circle, crystal diagram, triangular diagram, diamond diagram, pentagon diagram, hexagon diagram, heptagon diagram, cycle diagram (cycle chart), stacked Venn diagram (onion diagram), arrow circle diagram.
The example of marketing diagrams templates "Design elements - Circular diagrams" for the ConceptDraw PRO diagramming and vector drawing software is included the Target and Circular Diagrams solution from the Marketing area of ConceptDraw Solution Park.
www.conceptdraw.com/ solution-park/ marketing-target-and-circular-diagrams
Circular diagrams templates
How to Create a Pie Chart

 Business Diagrams Package
Business Diagrams Package is a large set of comprehensive graphical solutions from the ConceptDraw Solution Park, which are powerful in solving the business, marketing and quality tasks in completely different fields, such as finance, education, health food and cooking, HR, and many others. The tools of this package's solutions are a powerful assistant in drawing all diversity of Financial and Marketing infographics, Business process workflow diagrams, Organizational charts, Education infographics, Quality diagrams, Health food diagrams, HR flowcharts, as well as different graphics and charts, which depict the values of key business indicators, their dependencies, give the full understanding of a situation within a company and on the market.
- Pie Chart Software | Doughnut chart - Template | Donut Chart ...
- Donut Chart Templates | Quarter Sales Revenue for Top 10 ...
- Visio Donut Chart
- Doughnut chart - Template | Design elements - Pie charts | Quarter ...
- How to Draw the Different Types of Pie Charts | Circular arrows ...
- Donut Chart | Pie Chart Software | Donut Chart Templates ...
- Donut Chart Templates | Pie Chart Examples and Templates | Donut ...
- Difference Between Pie Chart And Doughnut Chart
- Doughnut chart - Template
- Doughnut chart - Template | Virtuous circle (management) - Ring ...
- Doughnut Process Flow Chart
- Data Visualization Solutions | Pie Chart Software | Doughnut chart ...
- Arrow circle chart - Template | Donut chart - Template | Pie charts ...
- Wireframe Doughnut Chart
- Design elements - Marketing charts | Schedule pie chart - Daily ...
- Doughnut Chart In Wikipedia
- Circular arrows diagrams - Vector stencils library | Pie Chart ...
- Pie Donut Chart . Pie Chart Examples
- Donut Chart
- Donut Chart
- ERD | Entity Relationship Diagrams, ERD Software for Mac and Win
- Flowchart | Basic Flowchart Symbols and Meaning
- Flowchart | Flowchart Design - Symbols, Shapes, Stencils and Icons
- Flowchart | Flow Chart Symbols
- Electrical | Electrical Drawing - Wiring and Circuits Schematics
- Flowchart | Common Flowchart Symbols
- Flowchart | Common Flowchart Symbols