Pie Chart Software

ConceptDraw PRO software with Pie Charts solution helps to create pie and donut charts for effective displaying proportions in statistics, business and mass media for composition comparison, i.e. for visualization of part percentage inside one total.
Pie Donut Chart. Pie Chart Examples

The Pie Donut Chart visualizes the percentage of parts of the whole and looks like as a ring divided into sectors. Pie Donut Charts are widely used in the business, statistics, analytics, mass media.
Donut Chart Templates

All these donut chart templates are included in the Pie Charts solution.
You can quickly rework these examples into your own charts by simply changing displayed data, title and legend texts.
How to Create a Pie Chart

Pie Chart Examples and Templates

Pie chart examples and templates created using ConceptDraw PRO software helps you get closer with pie charts and find pie chart examples suite your needs.
Pie Chart Word Template. Pie Chart Examples

The vector stencils library "Pie charts" contains 30 templates of pie and donut (doughnut, ring) charts for visualizing percentage for parts of one total, or compare parts of few totals.
Drag a template from the library into your document and enter your data.
Use these shapes to draw your pie charts and donut charts in the ConceptDraw PRO diagramming and vector drawing software.
The vector stencils library "Pie charts" is included in the Pie Charts solution of the Graphs and Charts area in ConceptDraw Solution Park.
Pie chart (table)
-pie-charts---vector-stencils-library.png--diagram-flowchart-example.png)
Pie chart

Percentage pie chart

Pie chart, control dots

Separated pie chart

Percentage separated pie chart

Pie chart with shifted slices

Percentage pie chart with shifted slices

Ring chart (table)
-pie-charts---vector-stencils-library.png--diagram-flowchart-example.png)
Ring chart

Percentage ring chart

Ring chart 2

Percentage ring chart 2

Ring chart, control dots

Arrow ring chart
Percentage arrow ring chart
Pie chart (light)
-pie-charts---vector-stencils-library.png--diagram-flowchart-example.png)
Percentage pie chart (light)
-pie-charts---vector-stencils-library.png--diagram-flowchart-example.png)
Pie chart (light), control dots
,-control-dots-pie-charts---vector-stencils-library.png--diagram-flowchart-example.png)
Separated pie chart (light)
-pie-charts---vector-stencils-library.png--diagram-flowchart-example.png)
Percentage separated pie chart (light)
-pie-charts---vector-stencils-library.png--diagram-flowchart-example.png)
Pie chart with shifted slices (light)
-pie-charts---vector-stencils-library.png--diagram-flowchart-example.png)
Percentage pie chart with shifted slices (light)
-pie-charts---vector-stencils-library.png--diagram-flowchart-example.png)
Ring chart (light)
-pie-charts---vector-stencils-library.png--diagram-flowchart-example.png)
Percentage ring chart (light)
-pie-charts---vector-stencils-library.png--diagram-flowchart-example.png)
Ring chart (light) 2
-2-pie-charts---vector-stencils-library.png--diagram-flowchart-example.png)
Percentage ring chart (light) 2
-2-pie-charts---vector-stencils-library.png--diagram-flowchart-example.png)
Ring chart (light), control dots
,-control-dots-pie-charts---vector-stencils-library.png--diagram-flowchart-example.png)
Arrow ring chart (light)
Percentage arrow ring chart (light)
Percentage Pie Chart. Pie Chart Examples

This sample shows the Pie Chart of the approximate air composition. You can see the percentage of oxygen, nitrogen and other gases in the air visualized on this Pie Chart.
 Pie Charts
Pie Charts are extensively used in statistics and business for explaining data and work results, in mass media for comparison (i.e. to visualize the percentage for the parts of one total), and in many other fields. The Pie Charts solution for ConceptDraw PRO v10 offers powerful drawing tools, varied templates, samples, and a library of vector stencils for simple construction and design of Pie Charts, Donut Chart, and Pie Graph Worksheets.
HelpDesk
How to Draw a Pie Chart Using ConceptDraw PRO

HelpDesk
How to Draw the Different Types of Pie Charts
 Basic Pie Charts
This solution extends the capabilities of ConceptDraw PRO v10.3.0 (or later) with templates, samples, and a library of vector stencils for drawing pie and donut charts.
This ring chart sample was redesigned from the Wikipedia file: Virtuous circle in management.svg.
"An example of the use of a virtuous circle in management."
[en.wikipedia.org/ wiki/ File:Virtuous_ circle_ in_ management.svg]
"A virtuous circle and a vicious circle (also referred to as virtuous cycle and vicious cycle) are economic terms. They refer to a complex chain of events that reinforces itself through a feedback loop. A virtuous circle has favorable results, while a vicious circle has detrimental results.
Both circles are complexes of events with no tendency towards equilibrium (at least in the short run). Both systems of events have feedback loops in which each iteration of the cycle reinforces the previous one (positive feedback). These cycles will continue in the direction of their momentum until an external factor intervenes and breaks the cycle. The prefix "hyper-" is sometimes used to describe these cycles if they are extreme. The best-known example of a vicious circle is hyperinflation. ...
Example in management.
Virtuous circle.
An employer's investment in his employees’ ability to provide superior service to customers can be seen as a virtuous circle. Effort spent in selecting and training employees and creating a corporate culture in which they are empowered can lead to increased employee satisfaction and employee competence. This can result in superior service delivery and customer satisfaction. This in turn will create customer loyalty, improved sales levels, and higher profit margins. Some of these profits can be reinvested in employee development, thereby initiating another iteration of a virtuous cycle." [en.wikipedia.org/ wiki/ Virtuous_ circle_ and_ vicious_ circle]
The ring chart example "Virtuous circle (management)" was created using the ConceptDraw PRO diagramming and vector drawing software extended with the Target and Circular Diagrams solution from the Marketing area of ConceptDraw Solution Park.
www.conceptdraw.com/ solution-park/ marketing-target-and-circular-diagrams
Ring chart
---ring-chart.png--diagram-flowchart-example.png)
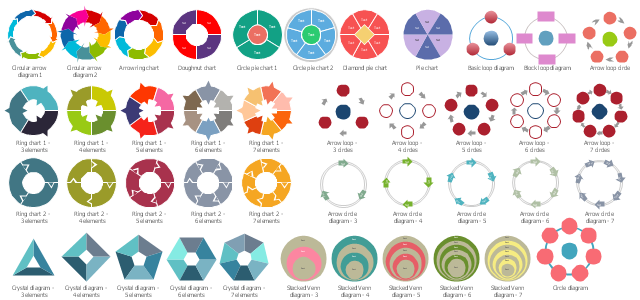
The vector stencils library "Circular diagrams" contains 42 templates of circular diagrams: circular arrow diagram, circular motion diagram, arrow ring chart, doughnut chart (donut chart), circle pie chart, diamond pie chart, circle diagram, pie chart, ring chart, loop diagram, block loop diagram, arrow loop circle, crystal diagram, triangular diagram, diamond diagram, pentagon diagram, hexagon diagram, heptagon diagram, cycle diagram (cycle chart), stacked Venn diagram (onion diagram), arrow circle diagram.
Use these shapes to illustrate your marketing and sales documents, presentations, webpages and infographics in the ConceptDraw PRO diagramming and vector drawing software extended with the Target and Circular Diagrams solution from the Marketing area of ConceptDraw Solution Park.
www.conceptdraw.com/ solution-park/ marketing-target-and-circular-diagrams
Circular arrow diagram 1
Circular arrow diagram 2
Arrow ring chart
Doughnut chart

Diamond pie chart

Pie chart

Circle diagram

Circle pie chart 2

Circle pie chart 1

Ring chart 1 - 3 elements

Ring chart 1 - 4 elements

Ring chart 1 - 5 elements

Ring chart 1 - 6 elements

Ring chart 1 - 7 elements

Ring chart 2 - 3 elements

Ring chart 2 - 4 elements

Ring chart 2 - 5 elements

Ring chart 2 - 6 elements

Ring chart 2 - 7 elements

Crystal diagram - 3 elements

Crystal diagram - 4 elements

Crystal diagram - 5 elements

Crystal diagram - 6 elements

Crystal diagram - 7 elements

Stacked Venn diagram - 4

Stacked Venn diagram - 5

Stacked Venn diagram - 6

Stacked Venn diagram - 7

Basic loop diagram

Block loop diagram

Arrow loop circle
Arrow loop - 3 circles
Arrow loop - 4 circles
Arrow loop - 5 circles
Arrow loop - 6 circles
Arrow loop - 7 circles
Arrow circle diagram - 3
Arrow circle diagram - 4
Stacked Venn diagram - 3

Arrow circle diagram - 5
Arrow circle diagram - 6
Arrow circle diagram - 7
The vector stencils library "Circular diagrams" contains 42 templates of circular diagrams: circular arrow diagram, circular motion diagram, arrow ring chart, doughnut chart (donut chart), circle pie chart, diamond pie chart, circle diagram, pie chart, ring chart, loop diagram, block loop diagram, arrow loop circle, crystal diagram, triangular diagram, diamond diagram, pentagon diagram, hexagon diagram, heptagon diagram, cycle diagram (cycle chart), stacked Venn diagram (onion diagram), arrow circle diagram.
The example of marketing diagrams templates "Design elements - Circular diagrams" for the ConceptDraw PRO diagramming and vector drawing software is included the Target and Circular Diagrams solution from the Marketing area of ConceptDraw Solution Park.
www.conceptdraw.com/ solution-park/ marketing-target-and-circular-diagrams
Circular diagrams templates
- Pie Chart Software | Doughnut chart - Template | Donut Chart ...
- Donut Chart
- Donut Chart | Pie Chart Word Template. Pie Chart Examples | Pie ...
- Donut Chart | Pie Chart Software | Pie Donut Chart . Pie Chart ...
- Pie Chart Software | How to Draw the Different Types of Pie Charts ...
- Pie Charts | Arrow circle chart - Template | Pie Chart Examples and ...
- Donut Chart Templates | Pie Chart Software | Ring chart - Template ...
- Doughnut Chart Software
- Pie Chart Software | Pie Donut Chart . Pie Chart Examples | How to ...
- Flow Chart In A Donut
- Pie Chart Software | Circular arrows diagrams - Vector stencils ...
- Pie Chart Examples and Templates | Donut Chart Templates ...
- Visio Donut Chart
- Pie Chart Software | Basic Pie Charts | Circular diagrams - Vector ...
- Pie Charts | Design elements - Pie charts | Pie Chart Software ...
- Circular diagrams - Vector stencils library | Pie Chart Software | Pie ...
- Donut Chart Templates | Pie Chart Examples and Templates | Donut ...
- Schedule pie chart - Daily action plan | Pie Chart Examples and ...
- Arrow circle chart - Template | Pie Chart Software | How to Draw the ...
- Doughnut chart - Template | Donut Chart Templates | Pie Chart ...
- ERD | Entity Relationship Diagrams, ERD Software for Mac and Win
- Flowchart | Basic Flowchart Symbols and Meaning
- Flowchart | Flowchart Design - Symbols, Shapes, Stencils and Icons
- Flowchart | Flow Chart Symbols
- Electrical | Electrical Drawing - Wiring and Circuits Schematics
- Flowchart | Common Flowchart Symbols
- Flowchart | Common Flowchart Symbols