Basic Flowchart Symbols and Meaning


ERD Symbols and Meanings

The Chen's ERD notation is still used and is considered to present a more detailed way of representing entities and relationships.
To create an ERD, software engineers mainly turn to dedicated drawing software, which contain the full notation resources for their specific database design - ERD symbols and meanings. CS Odessa has released an all-inclusive Entity-Relationship Diagram (ERD) solution for their powerful drawing program, ConceptDraw DIAGRAM.

Entity Relationship Diagram Symbols

ERD symbols used for professional ERD drawing are collected in libraries from the Entity-Relationship Diagram (ERD) solution for ConceptDraw DIAGRAM.
IDEF3 Standard

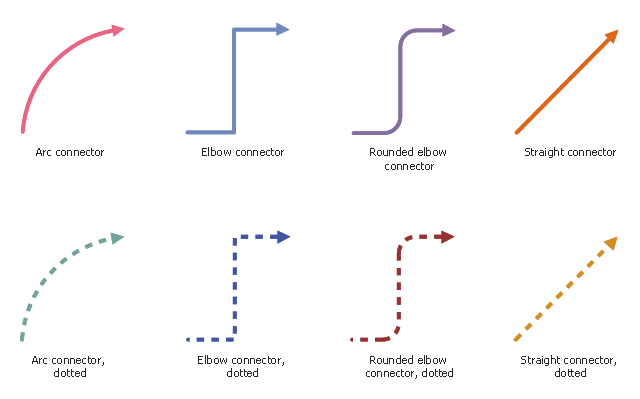
Business Process Flowchart Symbols

The vector stencils library "Workflow connectors" contains 8 flow lines.
Use it to design your business process workflow diagrams with ConceptDraw PRO software.
"A flowchart is a type of diagram that represents an algorithm, workflow or process, showing the steps as boxes of various kinds, and their order by connecting them with arrows. ...
Flow Line ... An arrow coming from one symbol and ending at another symbol represents that control passes to the symbol the arrow points to. The line for the arrow can be solid or dashed. The meaning of the arrow with dashed line may differ from one flowchart to another and can be defined in the legend." [Flowchart. Wikipedia]
The flowchart arrows example "Design elements - Workflow connectors" is included in the Business Process Workflow Diagrams solution from the Business Processes area of ConceptDraw Solution Park.
Flow lines
Flowchart Programming Project. Flowchart Examples

Garrett IA Diagrams with ConceptDraw DIAGRAM

Flowchart Components

IDEF0 standard with ConceptDraw DIAGRAM

According to the IDEF0 standard any process can be described in the form of a block (Activity Box) which has inputs and outputs. The process consists in transformation of inputs into outputs under the influence of the management and in the presence of necessary resources. Outputs of the given process later on can be either inputs for the next process or resources, or management means.
- Flow Chart Broken Line Meaning
- Meaning Of Dotted Line In Er Diagram
- Dotted Line In Flowchart Meaning
- Flowchart Dotted Line
- Dot Line In Organization Chart
- Dotted Line Connectors
- Why We Use Dotted Line Ina Flow Chart
- IDEF3 Standard | Organizational Chart Broken Line Symbol
- When To Use Dotted Line In Flowchart
- Flowchart Dashed Line
- ERD | Entity Relationship Diagrams, ERD Software for Mac and Win
- Flowchart | Basic Flowchart Symbols and Meaning
- Flowchart | Flowchart Design - Symbols, Shapes, Stencils and Icons
- Flowchart | Flow Chart Symbols
- Electrical | Electrical Drawing - Wiring and Circuits Schematics
- Flowchart | Common Flowchart Symbols
- Flowchart | Common Flowchart Symbols