Pie Graph Worksheets

HelpDesk
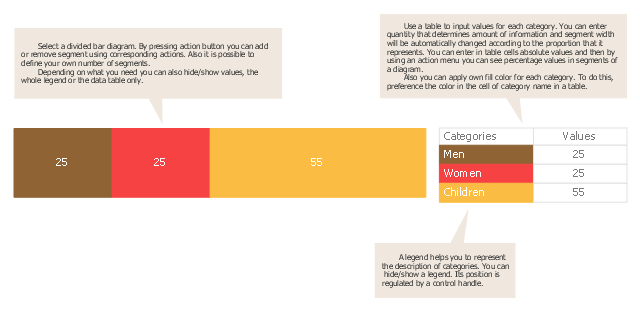
How to Draw a Divided Bar Chart in ConceptDraw PRO

 Divided Bar Diagrams
The Divided Bar Diagrams Solution extends the capabilities of ConceptDraw PRO v10 with templates, samples, and a library of vector stencils for drawing high impact and professional Divided Bar Diagrams and Graphs, Bar Diagram Math, and Stacked Graph.
Use this chart template to design your divided bar diagrams.
A divided bar chart is a rectangle divided into segments, illustrating numerical proportion. In a divided bar chart, the length of each segment (and consequently its area), is proportional to the quantity it represents.
This divided bar graph displays the number of people per day who visited swimming pool.
The template "Divided bar diagram" for the ConceptDraw PRO diagramming and vector drawing software is included in the Divided Bar Diagrams solution from the Graphs and Charts area of ConceptDraw Solution Park.
Template
What Is a Picture Graph?

 Basic Divided Bar Diagrams
This solution extends the capabilities of ConceptDraw PRO v10.3.0 (or later) with templates, samples and a library of vector stencils for drawing Divided Bar diagrams.
Bar Graph

 Bar Graphs
The Bar Graphs solution enhances ConceptDraw PRO v10 functionality with templates, numerous professional-looking samples, and a library of vector stencils for drawing different types of Bar Graphs, such as Simple Bar Graph, Double Bar Graph, Divided Bar Graph, Horizontal Bar Graph, Vertical Bar Graph, and Column Bar Chart.
Scatter Graph Charting Software

Pie Donut Chart. Pie Chart Examples

The Pie Donut Chart visualizes the percentage of parts of the whole and looks like as a ring divided into sectors. Pie Donut Charts are widely used in the business, statistics, analytics, mass media.
Stacked Graph

Bar Chart

Bar Diagram Math

Chart Maker for Presentations

Basic Diagramming


- Pie Graph Worksheets | How to Draw a Divided Bar Chart in ...
- Percentage Pie Chart . Pie Chart Examples
- Divided Bar Diagrams | Pie Graph Worksheets | Percentage Pie ...
- Bar Graphs | Divided Bar Diagrams | Percentage Pie Chart . Pie ...
- Diagram Illustrating Divided Bar Chart
- How to Draw a Divided Bar Chart in ConceptDraw PRO | Divided ...
- How to Draw a Divided Bar Chart in ConceptDraw PRO | Divided ...
- Bar Diagram Math | Financial Comparison Chart | Pie Graph ...
- Diagramatic Of Divided Bar Graph
- Pie Graph Worksheets | Bar Graph | Chart Examples | Images Of Bar ...
- Pie Charts | Logistics Flow Charts | Bar Diagram Math | Natural ...
- Bar Diagram Math | Divided Bar Diagrams | Basic Diagramming ...
- Geo Map - Asia - Philippines | Bar Diagram Math | Divided Bar ...
- Divided Bar Diagrams | Bar Graphs | Bar Chart Template for Word ...
- Create Graphs and Charts | Pie Graph Worksheets | Bar Graphs ...
- Pie Charts | Bar Diagram Math | Pie Graph Worksheets ...
- Divided Bar Diagrams
- Pie Graph Worksheets | Rainfall Bar Chart | Create Graphs and ...
- Divided Bar Diagrams | Pie Charts | Manufacturing and Maintenance ...
- Nature | People | Divided Bar Graph Kids
- ERD | Entity Relationship Diagrams, ERD Software for Mac and Win
- Flowchart | Basic Flowchart Symbols and Meaning
- Flowchart | Flowchart Design - Symbols, Shapes, Stencils and Icons
- Flowchart | Flow Chart Symbols
- Electrical | Electrical Drawing - Wiring and Circuits Schematics
- Flowchart | Common Flowchart Symbols
- Flowchart | Common Flowchart Symbols