UML Deployment Diagram

Use ConceptDraw DIAGRAM with UML deployment diagram templates, samples and stencil library from Rapid UML solution to model the physical deployment of artifacts on nodes of your software system.

UML Deployment Diagram. Design Elements

ConceptDraw has 393 vector stencils in the 13 libraries that helps you to start using software for designing your own UML Diagrams. You can use the appropriate stencils of UML notation from UML Deployment library.
UML Class Diagram Notation

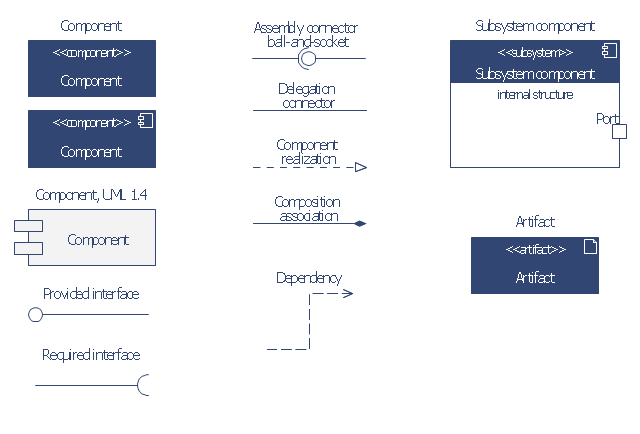
The vector stencils library "Bank UML component diagram" contains 13 shapes for drawing UML component diagrams.
Use it for object-oriented modeling of your bank information system.
"A component is something required to execute a stereotype function. Examples of stereotypes in components include executables, documents, database tables, files, and library files.
Components are wired together by using an assembly connector to connect the required interface of one component with the provided interface of another component. This illustrates the service consumer - service provider relationship between the two components. ...
When using a component diagram to show the internal structure of a component, the provided and required interfaces of the encompassing component can delegate to the corresponding interfaces of the contained components. ...
Symbols.
This may have a visual stereotype in the top right of the rectangle of a small rectangle with two even smaller rectangles jutting out on the left.
The lollipop, a small circle on a stick represents an implemented or provided interface. The socket symbol is a semicircle on a stick that can fit around the lollipop. This socket is a dependency or needed interface." [Component diagram. Wikipedia]
This example of UML component diagram symbols for the ConceptDraw PRO diagramming and vector drawing software is included in the ATM UML Diagrams solution from the Software Development area of ConceptDraw Solution Park.
UML component diagram symbols
Flow Chart Symbols

Flowchart diagrams consists of symbols of process, decision, data and document, data base, termination or initiation processes, processing loops and conditions. To create an drawn flowchart use professional flowchart maker of ConceptDraw DIAGRAM.
Electrical Symbols, Electrical Diagram Symbols

This solution provides 26 libraries which contain 926 electrical symbols from electrical engineering: Analog and Digital Logic, Composite Assemblies, Delay Elements, Electrical Circuits, Electron Tubes, IGFET, Inductors, Integrated Circuit, Lamps, Acoustics, Readouts, Logic Gate Diagram, MOSFET, Maintenance, Power Sources, Qualifying, Resistors, Rotating Equipment, Semiconductor Diodes, Semiconductors, Stations, Switches and Relays, Terminals and Connectors, Thermo, Transformers and Windings, Transistors, Transmission Paths,VHF UHF SHF.
Entity Relationship Diagram Symbols

ERD symbols used for professional ERD drawing are collected in libraries from the Entity-Relationship Diagram (ERD) solution for ConceptDraw DIAGRAM.
UML Timing Diagram, Design Elements

ConceptDraw has 393 vector stencils in the 13 libraries that helps you to start using software for designing your own UML Diagrams. You can use the appropriate stencils of UML notation from UML Timing library.
UML Diagrams with ConceptDraw DIAGRAM

ConceptDraw DIAGRAM is a software that provides possibility of detailed UML diagrams. A large number of stencils that coresponds to UML diagram notation and task-oriented templates.
Data structure diagram with ConceptDraw DIAGRAM

Basic Flowchart Symbols and Meaning


Local area network (LAN). Computer and Network Examples
 diagram")
ConceptDraw - Perfect Network Diagramming Software with examples of LAN Diagrams. ConceptDraw Network Diagram is ideal for network engineers and network designers who need to draw Local Area Network diagrams.

ERD Symbols and Meanings

The Chen's ERD notation is still used and is considered to present a more detailed way of representing entities and relationships.
To create an ERD, software engineers mainly turn to dedicated drawing software, which contain the full notation resources for their specific database design - ERD symbols and meanings. CS Odessa has released an all-inclusive Entity-Relationship Diagram (ERD) solution for their powerful drawing program, ConceptDraw DIAGRAM.

Entity Relationship Diagram Software

UML Diagram

Create unified modeling language (UML) diagrams with ConceptDraw.
ER Diagram Styles

UML Diagram Visio

Using the 13 libraries of the Rapid UML Solution for ConceptDraw DIAGRAM you can create your own visual vector UML diagrams quick and easy.
UML Diagramming Software

UML Diagram Editor

What is Entity-Relationship Diagram

The vector graphic ER diagrams produced when using ConceptDraw ERD solution can be used in whitepapers, presentations, datasheets, posters, or any technical materials.
- Entity Relationship Diagram Symbols
- Flowchart Components | Entity Relationship Diagram Symbols ...
- In Tabular Form Differentiate Between Symbolic And Component
- Distinguish Between Symbolic And Components Diagrams
- Electrical Symbols , Electrical Diagram Symbols | Basic Flowchart ...
- Difference Between Workflow And Flowchart
- Differences Between Crow S Foot And Chen Model
- UML Deployment Diagram . Diagramming Software for Design UML ...
- Differentiate Between Component Diagram And Deployment Diagram
- Difference Between Symbolic And Component
- Electrical Symbols , Electrical Diagram Symbols | Electrical Symbols ...
- Difference Between Component And Deployment Diagram
- Entity Relationship Diagram Symbols | Design Element: Crows Foot ...
- Swim Lane Flowchart Symbols | Swim Lane Diagrams | Swim Lanes ...
- Difference Between Architectural Diagram And Swimlane Diagram
- Entity Relationship Diagram Symbols | Components of ER Diagram ...
- Difference Between Process And Subprocess In Visio
- Data Flow Diagram (DFD)
- Electrical Symbols , Electrical Diagram Symbols | Electrical Symbols ...
- Basic Flowchart Symbols and Meaning | Flow Chart Symbols ...
- ERD | Entity Relationship Diagrams, ERD Software for Mac and Win
- Flowchart | Basic Flowchart Symbols and Meaning
- Flowchart | Flowchart Design - Symbols, Shapes, Stencils and Icons
- Flowchart | Flow Chart Symbols
- Electrical | Electrical Drawing - Wiring and Circuits Schematics
- Flowchart | Common Flowchart Symbols
- Flowchart | Common Flowchart Symbols