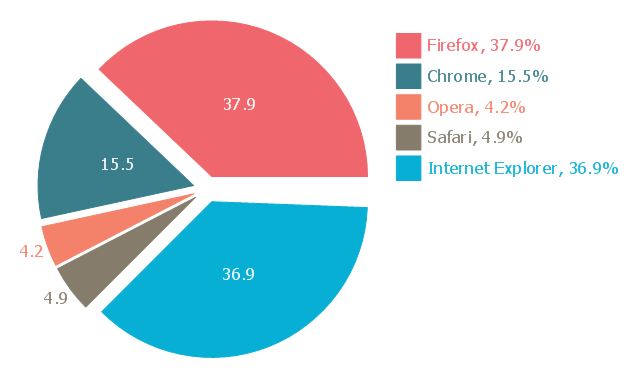
This exploded pie chart sample shows the Europe browser usage share in January 2011. It was designed on the base of the Wikimedia Commons file: 2011 01 Europe Browser share crop.png.
[commons.wikimedia.org/ wiki/ File:2011_ 01_ Europe_ Browser_ share_ crop.png]
This file is licensed under the Creative Commons Attribution 3.0 Unported license. [creativecommons.org/ licenses/ by/ 3.0/ deed.en]
"A chart with one or more sectors separated from the rest of the disk is known as an exploded pie chart. This effect is used to either highlight a sector, or to highlight smaller segments of the chart with small proportions." [Pie chart. Wikipedia]
The exploded pie chart example "Europe browser usage share" was created using the ConceptDraw PRO diagramming and vector drawing software extended with the Pie Charts solution of the Graphs and Charts area in ConceptDraw Solution Park.
Exploded pie chart
Flowchart design. Flowchart symbols, shapes, stencils and icons

Mavericks have always desired to stand apart and gorgeous design is the recipe for that. Any business graphic document will be more understandable if will use an expository color scheme for their parts. Flowchart design makes versatile presenting and explaining of the process and gives a fresh view that distinguishes it from black and white flowcharts on a paper. Workflow diagram or process flow diagrams become more understandable to ordinary people when it use minimum symbols and special signs.
The best design can be accomplished by starting from any of the suitable Conceptdraw examples. Pick one of them and begin to input proper text into each Flowchart symbols and shapes. Apply less colors in the document and don't turn into rainbow your diagram, three or four will be enough, also note that business process flowchart may not contain bright color hues. The next clue is to use identical colors for same flowchart shape types.

 Pie Charts
Pie Charts are extensively used in statistics and business for explaining data and work results, in mass media for comparison (i.e. to visualize the percentage for the parts of one total), and in many other fields. The Pie Charts solution for ConceptDraw DIAGRAM offers powerful drawing tools, varied templates, samples, and a library of vector stencils for simple construction and design of Pie Charts, Donut Chart, and Pie Graph Worksheets.
HelpDesk
Downloading the Old Versions of ConceptDraw Products

Network Icon
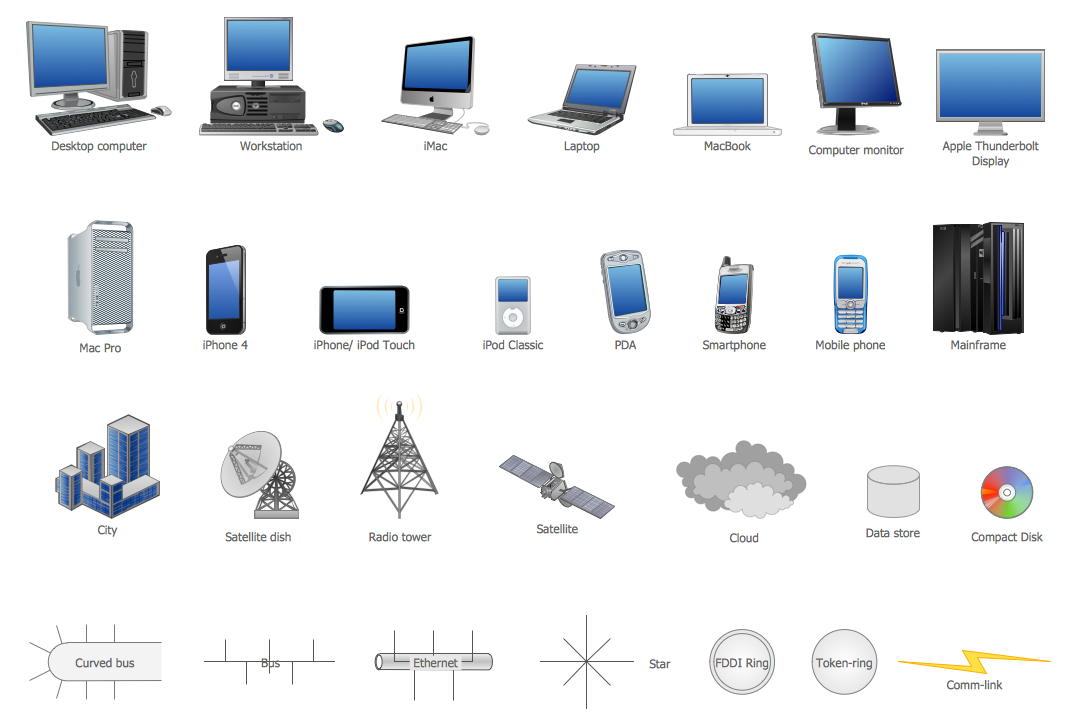
Network Icons
Classroom Layout

The vector stencils library "Media" contains 42 digital media icons.
Use it to design your audio, video and multimedia illustrations, presentations, web pages and infographics with ConceptDraw PRO diagramming and vector drawing software.
The vector stencils library "Media" is included in the Audio, Video, Media solution from the Illustration area of ConceptDraw Solution Park.
Multimedia

HD

DVD

Dolby

Pull down screen

DVD ROM

DVD video

DVD disk

DVD

CD

Compact disk 1

Compact disk 2

CD box

CD

Floppy

USB flash drive

USB drive

Flash drive

SIM card

Memory card

Micro SD card

Hard drive

E-book

Flashlight

Game device

CD drive 1

CD drive 2

CD player

MP4 player

Media player 1

Media player 2

Media player 3

Refresh

Stop

Play

Pause

Back

Forward

Money

People

People communication

Communication

Accounting Flowchart Symbols

Chart Templates

Bubble Chart
Pie Chart Examples and Templates

Pie chart examples and templates created using ConceptDraw DIAGRAM software helps you get closer with pie charts and find pie chart examples suite your needs.
The vector stencils library "Computer pictograms" contains 20 icons of computer symbols. Use it to draw your pictorial infographics. The example "Computer pictograms - Vector stencils library" was created using the ConceptDraw PRO diagramming and vector drawing software extended with the Pictorial infographics solution from the area "What is infographics" in ConceptDraw Solution Park.
Computer

Laptop computer

Sleep mode

Custom

Refresh

Remove

Add

Cancel

Accept

Fullscreen

Exchange

Log off

Setting

Cursor

Computer keyboard

Computer mouse

Media

File

Directory

Floppy disk

Business Process Flowchart Symbols

The vector stencils library "Audit flowcharts" contains 31 flow chart symbols.
Use it in accounting, financial management, fiscal information tracking, money management, decision making, and financial inventories to create auditing flowchart diagrams in the ConceptDraw PRO diagramming and vector drawing software extended with the Audit Flowcharts solution from the Finance and Accounting area of ConceptDraw Solution Park.
www.conceptdraw.com/ solution-park/ finance-audit-flowcharts
Tagged Process

Tagged Document

Decision

Manual operation

Terminator

Manual File

Display

On-page reference

Off-page reference

Divided (Table View)
-audit-flowcharts---vector-stencils-library.png--diagram-flowchart-example.png)
Process

Lined / shaded process

Lined Document

Document

Database

Disk Storage

Floppy disk

Magnetic Tape

Data Transmission

Manual input

Check 1 (audit)
-audit-flowcharts---vector-stencils-library.png--diagram-flowchart-example.png)
Compare 1

Reference point

Check 2 (audit)
-audit-flowcharts---vector-stencils-library.png--diagram-flowchart-example.png)
Compare 2

Event

Entity (Rounded Corners)
-audit-flowcharts---vector-stencils-library.png--diagram-flowchart-example.png)
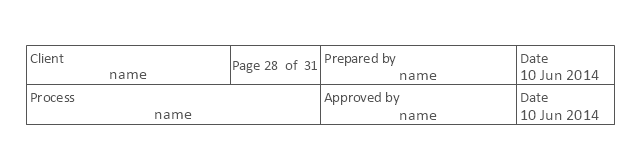
Title Block
Condition

Input/ Output

Delay

- Icon Job Disk Png
- Mp4 Icon Png
- Chart Templates | Chart Examples | Pie Charts | Percentage Chart Png
- Media - Vector stencils library | Digital video | Boombox Free Hd Png
- Music - Vector stencils library | Cd Cassette Clip On Png
- Video Disk Png
- Usb Disk Vector Png
- Flash Memory Png File
- Server Rack Png
- Wallet Images Png
- Reception Disk Top View Png
- Storage Devices Png
- Cd Box Png
- Trance Music Png
- Restaurant Floor Plans Samples | Reception Top View Png
- Video Vector Png
- Sim Card Logo Png
- Pop Png
- Usb Vector Png
- Png Money Vector
- ERD | Entity Relationship Diagrams, ERD Software for Mac and Win
- Flowchart | Basic Flowchart Symbols and Meaning
- Flowchart | Flowchart Design - Symbols, Shapes, Stencils and Icons
- Flowchart | Flow Chart Symbols
- Electrical | Electrical Drawing - Wiring and Circuits Schematics
- Flowchart | Common Flowchart Symbols
- Flowchart | Common Flowchart Symbols