This work flow chart sample was redesigned from the picture "Simulation for earthquake disaster assessment" from the article "Simulation Workflows".
[iaas.uni-stuttgart.de/ forschung/ projects/ simtech/ sim-workflows.php]
" This simulation was developed to have an in depth understanding of the destructions and the decisions to be made in various phases of crisis management (Source: Mahdi Hashemi and Ali A. Alesheikh (2010). "Developing an agent based simulation model for earthquakes in the context of SDI." GSDI 12 World Conference. 19 – 22 October 2010. Singapour). The simulation process contains following major steps:
(1) All spatial information including satellite images (before and after the earthquake) and topographic/ cadastral maps of the area are mosaicked and georeferenced. The parts of the city that contain various levels of destructions are selected. Three types of features namely buildings, roads and recreational areas are classified and extracted from the satellite images.
(2) The governing factors of destructions are identified; a mathematical model that integrates the factors is constructed.
(3) The simulation is constructed for various parameter values (different earthquake strength, time elapses, etc.)" [iaas.uni-stuttgart.de/ forschung/ projects/ simtech/ sim-workflows.php]
The example "Workflow diagram - Earthquake disaster assessment" was drawn using the ConceptDraw PRO diagramming and vector drawing software extended with the Workflow Diagrams solution from the Business Processes area of ConceptDraw Solution Park.
Work flow chart

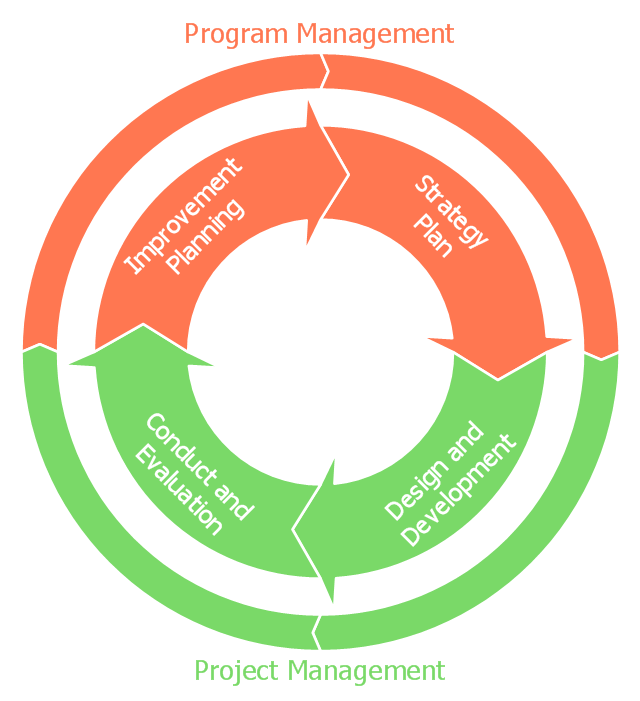
This circular arrows diagram sample shows the exercise cycle stages: 1) Strategy plan, 2) Design and development, 3) Conduct and evaluation, 4) Improvement planning. It was designed on the base of the diagram on the Emergency Management Insitute training IS-120.b webpage from the website of the Federal Emergency Management Agency (FEMA) of the United States Department of Homeland Security.
[emilms.fema.gov/ IS120A/ summary.htm]
"Exercises give communities, states, and regions a set of essential tools to prevent, prepare for, respond to, and recover from disasters." [emilms.fema.gov/ IS120A/ module0.htm]
"Disaster management (or emergency management) is the creation of plans through which communities reduce vulnerability to hazards and cope with disasters. Disaster management does not avert or eliminate the threats; instead, it focuses on creating plans to decrease the effect of disasters. Failure to create a plan could lead to human mortality, lost revenue, and damage to assets. Currently in the United States 60 percent of businesses do not have emergency management plans. Events covered by disaster management include acts of terrorism, industrial sabotage, fire, natural disasters (such as earthquakes, hurricanes, etc.), public disorder, industrial accidents, and communication failures." [Emergency management. Wikipedia]
The diagram example "Emergency management exercise cycle" was created using the ConceptDraw PRO diagramming and vector drawing software extended with the Basic Circular Arrows Diagrams solution from the area "What is a Diagram" of ConceptDraw Solution Park.
Circular arrows diagram
Emergency Plan


This example was created on the base of the figure from the website of Minnesota Department of Health. [health.state.mn.us/ divs/ opi/ qi/ images/ fishbone_ ex.png]
"Minnesota’s Health Alert Network (HAN) enables public health staff, tribal governments, health care providers, emergency workers, and others working to protect the public to exchange information during a disease outbreak, environmental threat, natural disaster, or act of terrorism." [health.state.mn.us/ han/ ]
The fishbone diagram example "HAN project" was created using the ConceptDraw PRO diagramming and vector drawing software extended with the Fishbone Diagrams solution from the Management area of ConceptDraw Solution Park.
Ishikawa diagram

Workflow Examples

 IDEF0 Diagrams
IDEF0 Diagrams visualize system models using the Integration Definition for Function Modeling (IDEF) methodology. Use them for analysis, development and integration of information and software systems, and business process modelling.
This arrow ring chart sample was created on the base of the figure illustrating the webpage "National Preparedness Cycle. Plan" from the Federal Emergency Management Agency (FEMA) website. "Planning makes it possible to manage the entire life cycle of a potential crisis. Strategic and operational planning establishes priorities, identifies expected levels of performance and capability requirements, provides the standard for assessing capabilities and helps stakeholders learn their roles. The planning elements identify what an organization’s Standard Operating Procedures (SOPs) or Emergency Operations Plans (EOPs) should include for ensuring that contingencies are in place for delivering the capability during a large-scale disaster." [fema.gov/ plan]
The arrow ring chart example "National Preparedness Cycle" was created using the ConceptDraw PRO diagramming and vector drawing software extended with the Target and Circular Diagrams solution from the Marketing area of ConceptDraw Solution Park.
www.conceptdraw.com/ solution-park/ marketing-target-and-circular-diagrams
Arrow ring chart
Work Flow Diagram

Any flow diagram can be sometimes seen as a counterpart of some flowchart being created with the help of the ConceptDraw PRO diagramming and drawing software as well as the Workflow Diagrams solution taken from the ConceptDraw STORE application.
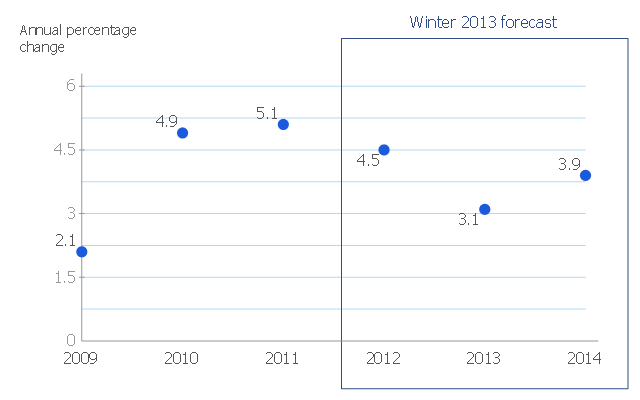
This scatter chart sample shows the MENA's (Middle East and North Africa's) real GDP growth. It was designed on the base scatter graph from the website of the European Economic Forecast (EUROPEAN ECONOMY 1|2013, Economic and Financial Affairs Winter 2013, European Commission). [ec.europa.eu/ economy_ finance/ publications/ european_ economy/ 2013/ pdf/ ee1_ en.pdf]
"The term MENA, for "Middle East and North Africa", is an acronym often used in academic, military planning, disaster relief, and business writing.
Due to the geographic ambiguity and Eurocentric nature of the term "Middle East", many people prefer use of the term WANA (West Asia and North Africa) or the less common NAWA (North Africa-West Asia).
The term covers an extensive region, extending from Morocco to Iran, including the majority of both the Middle Eastern and Maghreb countries. The term is roughly synonymous with the term the Greater Middle East. ...
MENA has no standardized definition; different organizations define the region as consisting of different territories. The following is a list of commonly included countries and territories: Bahrain, Egypt, Iran, Iraq, Israel, Jordan, Kuwait, Lebanon, Yemen, United Arab Emirates, Libya, Morocco, Oman, West Bank and Gaza, Qatar, Saudi Arabia, Syria, Tunisia, Algeria.
Sometimes also included in broader definitions: Armenia, Azerbaijan, Cyprus, Djibouti, Mauritania, Somalia, Sudan, Turkey, Western Sahara." [MENA. Wikipedia]
The scatter chart example "Middle East and North Africa's real GDP growth" was created using the ConceptDraw PRO diagramming and vector drawing software extended with the Line Graphs solution from the Graphs and Charts area of ConceptDraw Solution Park.
Scatter graph
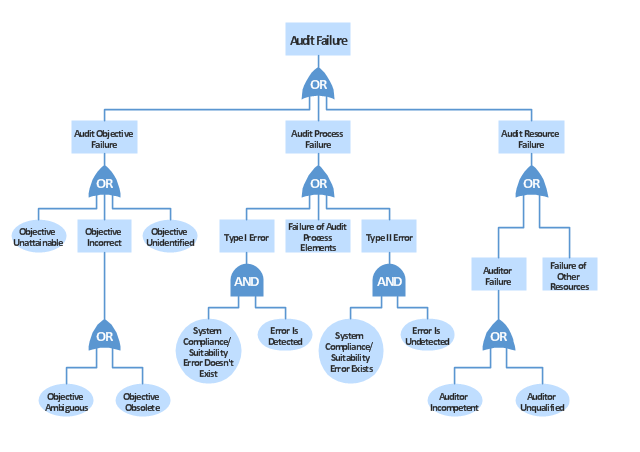
"Failure analysis is the process of collecting and analyzing data to determine the cause of a failure. It is an important discipline in many branches of manufacturing industry, such as the electronics industry, where it is a vital tool used in the development of new products and for the improvement of existing products. There are many companies which provide services to find the cause of failure in products, devices and in post disaster situations. The failure analysis process relies on collecting failed components for subsequent examination of the cause or causes of failure using a wide array of methods, especially microscopy and spectroscopy. The NDT or nondestructive testing methods (such as Industrial computed tomography scanning) are valuable because the failed products are unaffected by analysis, so inspection always starts using these methods." [Failure analysis. Wikipedia]
The example "Audit failure - Fault tree analysis diagram" was created using the ConceptDraw PRO diagramming and vector drawing software extended with the Fault Tree Analysis Diagrams solution from the Engineering area of ConceptDraw Solution Park.
The example "Audit failure - Fault tree analysis diagram" was created using the ConceptDraw PRO diagramming and vector drawing software extended with the Fault Tree Analysis Diagrams solution from the Engineering area of ConceptDraw Solution Park.
FTA diagram
An Event-driven Process Chain (EPC) - flowchart used for business process modelling
 flowchart used for business process modelling")
ConceptDraw PRO is a software for making EPC flowcharts to provide business process modelling. Its excellent business process improvement tools.
Types of Flowchart - Overview


This wheel diagram sample illustrates the emergency preparedness training and exercise processes. It was designed on the base of the diagram on the webpage "Public Health Preparedness Training and Exercise" from the FloridaHealth website of the Florida Department of Health. [floridahealth.gov/ programs-and-services/ emergency-preparedness-and-response/ training-exercise/ ]
"Emergency Preparedness is the discipline of dealing with and avoiding both natural and manmade disasters. It involves mitigation, preparedness, response and recovery in order to lessen the impact of disasters. Emergency management requires a partnership among all levels of government (local, State, and Federal) and the private sector (business and industry, voluntary organizations, and the public). Successful preparedness requires detailed planning and cooperation among each sector." [Emergency Preparedness. Wikipedia]
The arrow donut chart example "Training and exercise process wheel" was created using the ConceptDraw PRO diagramming and vector drawing software extended with the Circular Arrows Diagrams solution from the area "What is a Diagram" of ConceptDraw Solution Park.
Circular arrows diagram

Used Solutions
What Is an Action Mind Map

Beautiful Nature Scene: Drawing

- Chart Drawing In Disaster Management
- Charts On Disaster Management
- Pie Chart Natural Disaster In Mathematics
- Earthquake disaster assessment - Workflow diagram | About Sand ...
- Earthquake disaster assessment - Workflow diagram | Emergency ...
- Earthquake disaster assessment - Workflow diagram | Workflow ...
- Diagrams For Disaster Management
- Types of Flowchart - Overview | Earthquake disaster assessment ...
- Chart Of Disaster Management
- Risk management - Concept map | Concept Map On Disaster Risk
- Earthquake disaster assessment - Workflow diagram | Beautiful ...
- Emergency Plan | Earthquake disaster assessment - Workflow ...
- Disaster Cycle Using Schematic Diagram
- Disaster Concept Map
- Pie Charts | Mathematics | Basic Pie Charts | Disaster Management ...
- Disaster Management Cycle Draw A Flowchart And Describe It
- Disaster Risk Management Mind Map
- Product Proposal Documents Expanded | Mind Map About Disaster ...
- Pie Charts | Mathematics | Bar Graphs | Disaster Management Pie ...
- Tools to Create Your Own Infographics | Bargraph About Disaster ...
- ERD | Entity Relationship Diagrams, ERD Software for Mac and Win
- Flowchart | Basic Flowchart Symbols and Meaning
- Flowchart | Flowchart Design - Symbols, Shapes, Stencils and Icons
- Flowchart | Flow Chart Symbols
- Electrical | Electrical Drawing - Wiring and Circuits Schematics
- Flowchart | Common Flowchart Symbols
- Flowchart | Common Flowchart Symbols