HelpDesk
How to Create a Picture Graph

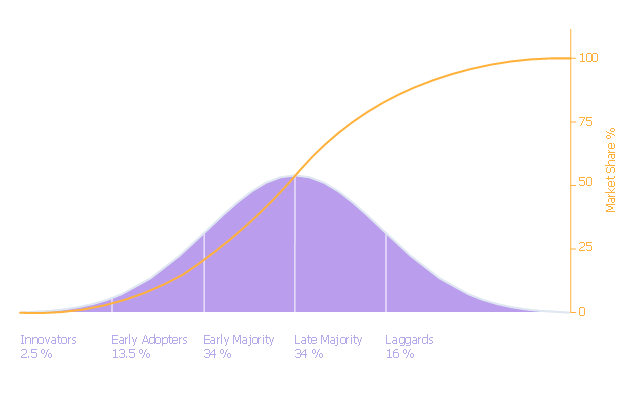
Diffusion of innovations (DOI) graph illustrates the diffusion of innovations theory.
"Diffusion of innovations is a theory that seeks to explain how, why, and at what rate new ideas and technology spread through cultures. Everett Rogers, a professor of communication studies, popularized the theory in his book Diffusion of Innovations... The book says that diffusion is the process by which an innovation is communicated through certain channels over time among the members of a social system. ... The book espouses the theory that there are four main elements that influence the spread of a new idea: the innovation, communication channels, time, and a social system. This process relies heavily on human capital. The innovation must be widely adopted in order to self-sustain. Within the rate of adoption, there is a point at which an innovation reaches critical mass. The categories of adopters are: innovators, early adopters, early majority, late majority, and laggards ... Diffusion of Innovations manifests itself in different ways in various cultures and fields and is highly subject to the type of adopters and innovation-decision process." [Diffusion of innovations. Wikipedia]
The marketing chart example "Diffusion of innovations graph" was created using the ConceptDraw PRO diagramming and vector drawing software extended with the Marketing Diagrams solution from the Marketing area of ConceptDraw Solution Park.
Marketing chart
 Sales Dashboard
Sales Dashboard solution extends ConceptDraw DIAGRAM software with templates, samples and library of vector stencils for drawing the visual dashboards of sale metrics and key performance indicators (KPI).
HelpDesk
How to Draw the Different Types of Pie Charts

Bubble diagrams in Landscape Design with ConceptDraw DIAGRAM

- Types Of Graphs
- Cross-Functional Flowchart | Different Types Of Graph To Represent ...
- How to Draw the Different Types of Pie Charts | Create Graphs and ...
- How to Draw the Different Types of Pie Charts | Pie Chart Software ...
- How to Draw the Different Types of Pie Charts | How to Draw a Pie ...
- Pie Charts | How to Draw the Different Types of Pie Charts | Pie ...
- Pie Chart Software | How to Draw the Different Types of Pie Charts ...
- Pie Charts | Pie Chart Software | How to Draw the Different Types of ...
- Graphs And Diagrams To Represent Data In Different Organizations
- Graph Illustrate Business Management
- Business and Finance | Picture Graphs | How to Create a Picture ...
- Picture Graph | Basic Diagramming | Types of Flowchart - Overview ...
- How to Draw the Different Types of Pie Charts | Composition ...
- Pie Chart Software | How to Draw the Different Types of Pie Charts ...
- Different Bar Charts
- Business Diagram Software | Create Graphs and Charts | Create ...
- Bar Graphs | Line Graphs | Picture Graphs | Graphs
- Pie Charts | Sales Growth. Bar Graphs Example | How to Draw the ...
- Percentage Pie Chart. Pie Chart Examples | How to Draw the ...
- Sales Growth. Bar Graphs Example | Pie Chart Examples and ...
- ERD | Entity Relationship Diagrams, ERD Software for Mac and Win
- Flowchart | Basic Flowchart Symbols and Meaning
- Flowchart | Flowchart Design - Symbols, Shapes, Stencils and Icons
- Flowchart | Flow Chart Symbols
- Electrical | Electrical Drawing - Wiring and Circuits Schematics
- Flowchart | Common Flowchart Symbols
- Flowchart | Common Flowchart Symbols