HelpDesk
Accounting Information Systems Flowchart Symbols

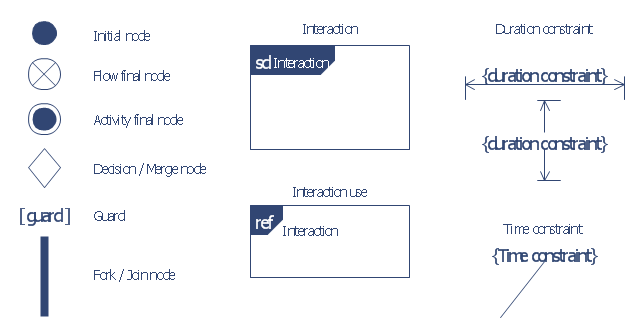
The vector stencils library "Bank UML interaction overview diagram" contains 11 shapes for drawing UML interaction overview diagrams.
Use it for object-oriented modeling of your bank information system.
"The interaction overview diagram is similar to the activity diagram, in that both visualize a sequence of activities. The difference is that, for an interaction overview, each individual activity is pictured as a frame which can contain a nested interaction diagrams. ...
The other notation elements for interaction overview diagrams are the same as for activity diagrams. These include initial, final, decision, merge, fork and join nodes. The two new elements in the interaction overview diagrams are the "interaction occurrences" and "interaction elements"." [Interaction overview diagram. Wikipedia]
This example of UML interaction overview diagram symbols for the ConceptDraw PRO diagramming and vector drawing software is included in the ATM UML Diagrams solution from the Software Development area of ConceptDraw Solution Park.
UML interaction overview diagram symbols
HelpDesk
Event-driven Process Chain (EPC) Diagram Software

An EPC diagram shows different business processes through various workflows. The workflows are seen as functions and events that are connected by different teams or people, as well as tasks that allow business processes to be executed. The best thing about this type of enterprise modelling is that creating an EPC diagram is quick and simple as long as you have the proper tool. One of the main usages of the EPC diagrams is in the modelling, analyzing and re-engineering of business processes. With the use of the flowchart, businesses are able to see inefficiencies in the processes and modify to make them more productive. Event-driven process chain diagrams are also used to configure an enterprise resource pla
- 4 Level pyramid model diagram - Information systems types | 5 Level ...
- Chart Of Management Information System With Diagram
- 4 Level pyramid model diagram - Information systems types | 5 Level ...
- Flowchart Symbols Accounting. Activity -based costing (ABC ...
- Process Flowchart | Automated payroll management system UML ...
- Types Of Information System In Hierarchical Form
- Accounting Information Systems Flowchart Symbols | Process ...
- How to Create Flowcharts for an Accounting Information System ...
- Business Process Elements: Activities | Design elements - Activities ...
- How to Create Flowcharts for an Accounting Information System ...
- Activity Diagrams For Library Information Systems
- How to Create Flowcharts for an Accounting Information System ...
- UML Activity Diagram
- Organisation Hierarchy Of Information System
- Types Of System At Different Levels Of Organisation
- Draw Information System Hierarchy
- Uml Activity Diagrams For C
- Design elements - UML activity diagrams | UML Flowchart Symbols ...
- 5 Level pyramid model diagram - Information systems types | Cbis ...
- Information System For Different Hierarchy In An Organization
- ERD | Entity Relationship Diagrams, ERD Software for Mac and Win
- Flowchart | Basic Flowchart Symbols and Meaning
- Flowchart | Flowchart Design - Symbols, Shapes, Stencils and Icons
- Flowchart | Flow Chart Symbols
- Electrical | Electrical Drawing - Wiring and Circuits Schematics
- Flowchart | Common Flowchart Symbols
- Flowchart | Common Flowchart Symbols