HelpDesk
How to Create a Timeline Diagram

Data structure diagram with ConceptDraw DIAGRAM

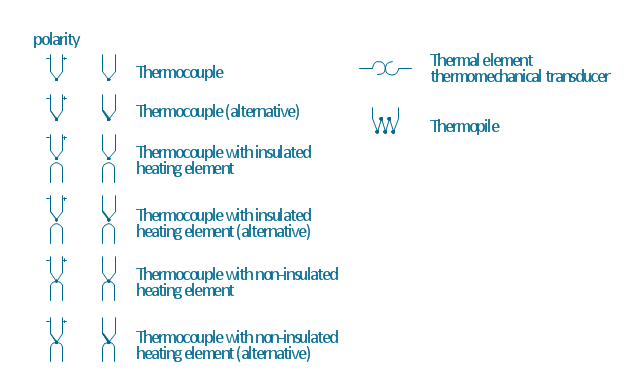
The vector stencils library "Thermo" contains 14 symbols of thermoelectric elements: thermal element, thermocouples with and without heating elements, thermoplile.
Use it for drawing electrical layouts, electronic schematics, and circuit diagrams.
"The thermoelectric effect is the direct conversion of temperature differences to electric voltage and vice versa. A thermoelectric device creates voltage when there is a different temperature on each side. Conversely, when a voltage is applied to it, it creates a temperature difference. At the atomic scale, an applied temperature gradient causes charge carriers in the material to diffuse from the hot side to the cold side.
This effect can be used to generate electricity, measure temperature or change the temperature of objects. Because the direction of heating and cooling is determined by the polarity of the applied voltage, thermoelectric devices can be used as temperature controllers.
The term "thermoelectric effect" encompasses three separately identified effects: the Seebeck effect, Peltier effect, and Thomson effect. Textbooks may refer to it as the Peltier–Seebeck effect. ...
Thermocouples and thermopiles are devices that use the Seebeck effect to measure the temperature difference between two objects, one connected to a voltmeter and the other to the probe. The temperature of the voltmeter, and hence that of the material being measured by the probe, can be measured separately using cold junction compensation techniques." [Thermoelectric effect. Wikipedia]
The shapes example "Design elements - Thermo" was drawn using the ConceptDraw PRO diagramming and vector drawing software extended with the Electrical Engineering solution from the Engineering area of ConceptDraw Solution Park.
Thermoelectric elements
Bubble diagrams in Landscape Design with ConceptDraw DIAGRAM

- Diff Btw System Flowchart And Program Flowchart
- Diff Between Application And System Flowchart
- Difference Between Algorithm And Flowchart
- Difference Between System Flowchart And Program Flowchart
- Difference Between Dfd And Context Diagram
- Difference Between Dfd And Erd In Software Engineering
- Difference Between Flow Chart And Bubble Diagram
- Difference Between Process And Workflow
- Difference Between Algorithm And Flowchart With Example
- Difference Between Flow Chart And Algorithm
- Difference Between System And Program Flow Chart
- Difference Between Workflow Diagram And Flowchart
- Difference Between Document Flowchart And Program Flowchart
- Difference Between Bubble Diagram And Flowchart
- Difference Between Workflow And Flowchart
- Difference Between Bubble Diagram And Flow Chart
- Difference Between Web Flow
- Difference Between Flowchart And Algorithm
- Difference Between Algorithm And Flowchart Shape
- Difference Between Flowchart And Dfd
- ERD | Entity Relationship Diagrams, ERD Software for Mac and Win
- Flowchart | Basic Flowchart Symbols and Meaning
- Flowchart | Flowchart Design - Symbols, Shapes, Stencils and Icons
- Flowchart | Flow Chart Symbols
- Electrical | Electrical Drawing - Wiring and Circuits Schematics
- Flowchart | Common Flowchart Symbols
- Flowchart | Common Flowchart Symbols