"Ecosystems represent sources of natural capital and provide goods and services to society, also called ecosystem services. The Millennium Ecosystem Assessment identified over 24 ecosystem services that can be divided up into 4 general groups including: 1) provisioning, 2) supporting, 3) regulating and 4) cultural." [User:Sawtoothgirl/ Sustainable Real Estate Development. Wikipedia]
"Humankind benefits in a multitude of ways from ecosystems. Collectively, these benefits are known as ecosystem services. Ecosystem services are regularly involved in the provisioning of clean drinking water and the decomposition of wastes. While scientists and environmentalists have discussed ecosystem services implicitly for decades, these the ecosystem services concept itself was popularized by the Millennium Ecosystem Assessment (MA) in the early 2000s. This grouped ecosystem services into four broad categories: provisioning, such as the production of food and water; regulating, such as the control of climate and disease; supporting, such as nutrient cycles and crop pollination; and cultural, such as spiritual and recreational benefits. To help inform decision-makers, many ecosystem services are being assigned economic values." [Ecosystem services. Wikipedia]
The segmented pyramid diagram example "Ecosystem goods and services" was redesigned using the ConceptDraw PRO diagramming and vector drawing software from Wikimedia Commons file ES_ triangle.png.
[commons.wikimedia.org/ wiki/ File:ES_ triangle.png]
This file is licensed under the Creative Commons Attribution-Share Alike 3.0 Unported license. [creativecommons.org/ licenses/ by-sa/ 3.0/ deed.en]
This segmented pyramid diagram example "Ecosystem goods and services" is included in the Pyramid Diagrams solution from the Marketing area of ConceptDraw Solution Park.
Pyramid diagram

Energy Pyramid Diagram

Energy Pyramid Diagram begins from the producers (plants) and proceeds through a few trophic levels of consumers (herbivores which eat these plants, the carnivores which eat these herbivores, then carnivores which eat those carnivores, and so on) to the top of the food chain.
Diagram of a Pyramid

This onion diagram sample was created on the base of the figure "Social Ecological Model (SEM)" illustrating the webpage "Cultural Competence" from the US Centers for Disease Control and Prevention (CDC) website.
"Why consider cultural competence?
It is important to communicate effectively to both the disparately affected population(s) of interest as well as other key stakeholders at the community, state, and national levels.
The diagram of the Social Ecological Model (SEM) ... depicts how health behaviors of an individual (inner oval) are influenced by the interpersonal, organizational, community, and public policy contexts and environment in which that person exists. Cultural context resides in the interpersonal band, making it a critical consideration when designing any communication plan. All obesity prevention communications should take the culture (e.g., language, thoughts, communications, actions, customs, beliefs, values, and institutions of racial, ethnic, religious, or social groups) of the target population into consideration to be effective. Interventions that successfully achieve this goal demonstrate cultural competence - behaviors, attitudes, and policies that come together in a system, agency, or among professionals to enable people to work effectively in a cross-cultural situation."
[cdc.gov/ obesity/ health_ equity/ culturalRelevance.html]
The onion diagram example "Social Ecological Model (SEM)" was created using the ConceptDraw PRO diagramming and vector drawing software extended with the Target and Circular Diagrams solution from the Marketing area of ConceptDraw Solution Park.
www.conceptdraw.com/ solution-park/ marketing-target-and-circular-diagrams
Onion diagram
---onion-diagram.png--diagram-flowchart-example.png)
This wheel diagram sample was created on the base of figure illustrating the webpage "Chapter 3: Current State of the Ecosystem" of the website of the National Broadband Plan of US Federal Communications Comission (FCC). "The broadband ecosystem includes applications and content: e-mail, search, news, maps, sales and marketing applications used by businesses, user-generated video and hundreds of thousands of more specialized uses. Ultimately, the value of broadband is realized when it delivers useful applications and content to end-users.
Applications run on devices that attach to the network and allow users to communicate: computers, smartphones, set-top boxes, e-book readers, sensors, private branch exchanges (PBX), local area network routers, modems and an ever-growing list of other devices. New devices mean new opportunities for applications and content.
Finally, broadband networks can take multiple forms: wired or wireless, fixed or mobile, terrestrial or satellite. Different types of networks have different capabilities, benefits and costs.
The value of being connected to the network increases as more people and businesses choose to adopt broadband and use applications and devices that the network supports. Several factors contribute to their decisions. These include whether they can afford a connection, whether they are comfortable with digital technology and whether they believe broadband is useful.
Networks, devices and applications drive each other in a virtuous cycle. If networks are fast, reliable and widely available, companies produce more powerful, more capable devices to connect to those networks. These devices, in turn, encourage innovators and entrepreneurs to develop exciting applications and content. These new applications draw interest among end-users, bring new users online and increase use among those who already subscribe to broadband services. This growth in the broadband ecosystem reinforces the cycle, encouraging service providers to boost the speed, functionality and reach of their networks."
[broadband.gov/ plan/ 3-current-state-of-the-ecosystem/ ]
The circle pie chart example "Forces shaping the broadband ecosystem in the US" was created using the ConceptDraw PRO diagramming and vector drawing software extended with the Target and Circular Diagrams solution from the Marketing area of ConceptDraw Solution Park.
www.conceptdraw.com/ solution-park/ marketing-target-and-circular-diagrams
Wheel diagram

 Pyramid Diagrams
Pyramid Diagrams solution extends ConceptDraw DIAGRAM software with templates, samples and library of vector stencils for drawing the marketing pyramid diagrams.
Pyramid Chart Examples

 Target and Circular Diagrams
This solution extends ConceptDraw DIAGRAM software with samples, templates and library of design elements for drawing the Target and Circular Diagrams.
Venn Diagram Examples for Problem Solving. Environmental Social Science. Human Sustainability Confluence

Create your Venn diagrams for problem solving in environmental social science using the ConceptDraw DIAGRAM diagramming and vector drawing software extended with the Venn Diagrams solution from the area "Diagrams" of ConceptDraw Solution Park.
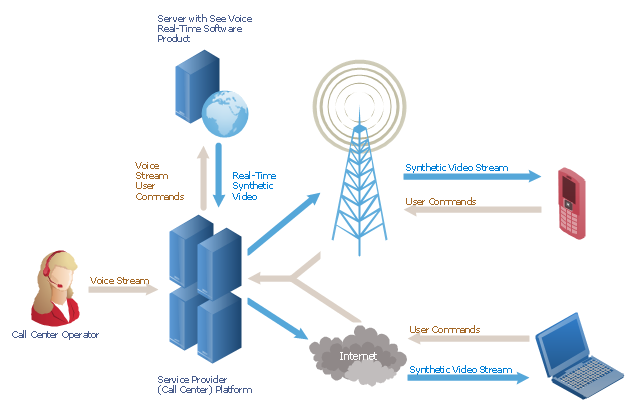
"A call centre or call center is a centralised office used for the purpose of receiving or transmitting a large volume of requests by telephone. An inbound call centre is operated by a company to administer incoming product support or information inquiries from consumers. Outbound call centers are operated for telemarketing, solicitation of charitable or political donations, debt collection and market research. In addition to a call centre, collective handling of letter, fax, live support software,social media and e-mail at one location is known as a contact centre.
A call centre is operated through an extensive open workspace for call centre agents, with work stations that include a computer for each agent, a telephone set or headset connected to a telecom switch, and one or more supervisor stations. It can be independently operated or networked with additional centres, often linked to a corporate computer network, including mainframes, microcomputers and LANs. Increasingly, the voice and data pathways into the centre are linked through a set of new technologies called computer telephony integration (CTI)." [Call centre. Wikipedia]
This call center network diagram example was created using the ConceptDraw PRO diagramming and vector drawing software extended with the Telecommunication Network Diagrams solution from the Computer and Networks area of ConceptDraw Solution Park.
Network scheme
Flowchart Components

Bar Diagrams for Problem Solving. Create event management bar charts with Bar Graphs Solution

This Venn diagram sample depicts the path to sustainable development.
"Sustainable development is an organizing principle for human life on a finite planet. It posits a desirable future state for human societies in which living conditions and resource-use meet human needs without undermining the sustainability of natural systems and the environment, so that future generations may also have their needs met.
Sustainable development ties together concern for the carrying capacity of natural systems with the social and economic challenges faced by humanity. As early as the 1970s, 'sustainability' was employed to describe an economy "in equilibrium with basic ecological support systems." Scientists in many fields have highlighted The Limits to Growth, and economists have presented alternatives, for example a 'steady state economy', to address concerns over the impacts of expanding human development on the planet." [Sustainable development. Wikipedia]
The Venn diagram example "Path to sustainable development" was created using the ConceptDraw PRO diagramming and vector drawing software extended with the Venn Diagrams solution from the area "What is a Diagram" of ConceptDraw Solution Park.
Venn diagram

This step chart sample shows engineering value chain. It was designed on the base of the Wikimedia Commons file: The engineering value chain.png. "The engineering value chain (EVC) refers to a series of engineering activities and capabilities contributing to value creation encompassing essential elements such as idea generation & selection, design & development, production & delivery, service & support, and disposal & recycling for example." [commons.wikimedia.org/ wiki/ File:The_ engineering_ value_ chain.png]
This file is licensed under the Creative Commons Attribution-Share Alike 3.0 Unported license. [creativecommons.org/ licenses/ by-sa/ 3.0/ deed.en]
The diagram example "Step chart - Value chain" was created using the ConceptDraw PRO diagramming and vector drawing software extended with the Marketing Diagrams solution from the Marketing area of ConceptDraw Solution Park.
Marketing diagram

Pyramid Diagram

- Ecosystem goods and services - Segmented pyramid diagram ...
- Levels Of Ecosystem Diagrams
- Block Diagram Of Ecosystem
- Diagram Of Trophic Levels In An Ecosystem
- Service-goods continuum diagram | Marketing diagrams - Vector ...
- Ecosystem Diagram With Arrow
- Pyramid Chart Examples | Energy Pyramid Diagram | Diagram of a ...
- Energy Pyramid Diagram | Ecosystem goods and services ...
- Ecosystem goods and services - Segmented pyramid diagram ...
- Energy Pyramid Diagram | Diagram of a Pyramid | Ecosystem Map ...
- Ecosystem Structure Diagram
- Easy Diagrams Of Ecosystem
- Service-goods continuum diagram | Ecosystem goods and services ...
- Four Dimensions Bubble Plot | Ecosystem goods and services ...
- Energy Pyramid Diagram | Pyramid Chart Examples | Ecosystem ...
- Ecosystem goods and services - Segmented pyramid diagram ...
- Venn Diagram | Garrett IA Diagrams with ConceptDraw PRO ...
- Pyramid Chart Examples | Pyramid Diagram | Ecosystem goods and ...
- Circular Flow Diagram Template | Circular Arrow | Circular Arrows ...
- Energy Pyramid Diagram | Diagram of a Pyramid | Pyramid ...
- ERD | Entity Relationship Diagrams, ERD Software for Mac and Win
- Flowchart | Basic Flowchart Symbols and Meaning
- Flowchart | Flowchart Design - Symbols, Shapes, Stencils and Icons
- Flowchart | Flow Chart Symbols
- Electrical | Electrical Drawing - Wiring and Circuits Schematics
- Flowchart | Common Flowchart Symbols
- Flowchart | Common Flowchart Symbols