The vector stencils library "Fault tree analysis diagrams" contains 12 symbols for drawing Fault Tree Analysis (FTA) diagrams.
"Fault tree analysis (FTA) is a top down, deductive failure analysis in which an undesired state of a system is analyzed using Boolean logic to combine a series of lower-level events. This analysis method is mainly used in the fields of safety engineering and reliability engineering to understand how systems can fail, to identify the best ways to reduce risk or to determine (or get a feeling for) event rates of a safety accident or a particular system level (functional) failure. FTA is used in the aerospace, nuclear power, chemical and process, pharmaceutical, petrochemical and other high-hazard industries; but is also used in fields as diverse as risk factor identification relating to social service system failure.
In aerospace, the more general term "system Failure Condition" is used for the "undesired state" / Top event of the fault tree. These conditions are classified by the severity of their effects. The most severe conditions require the most extensive fault tree analysis. These "system Failure Conditions" and their classification are often previously determined in the functional Hazard analysis." [Fault tree analysis. Wikipedia]
The shapes example "Fault tree analysis diagrams" was created using the ConceptDraw PRO diagramming and vector drawing software extended with the Fault Tree Analysis Diagrams solution from the Engineering area of ConceptDraw Solution Park.
FTA diagram symbols

This arrow loop diagram sample was created on the base of the figure illustrating the webpage "Safe Roads for a Safer Future A Joint Safety Strategic Plan" from the website of US Department of Transportation - Federal Highway Administration (FHWA) Office of Safety.
"STRATEGIC PLANNING CYCLE.
After the safety units issue the SSP, they will identify and prioritize strategies to support the established goals. Many strategies will originate in existing roadmaps or in other program planning activities. The safety units will also use this information when developing their Unit Performance Plans and individual performance plans. Teams within each safety unit will carry out projects and activities to support identified strategies and achieve the SSP goals.
The SSP process also includes continuous performance monitoring and evaluation through which the safety units will review past accomplishments against the established goals, consider how well strategies are implemented, assess progress toward goals, identify risks, consider changes in the environment, and discuss future strategic direction. As a part of the evaluation process, the three safety units will recognize achievements and discuss the need for adjustments. Figure ... shows the strategic planning cycle.
The safety units will update the SSP every 3 to 5 years using input from a variety of sources, including evaluations, safety trends, and legislative changes." [safety.fhwa.dot.gov/ ssp/ ]
The arrow loop diagram example "Strategic planning cycle" was created using the ConceptDraw PRO diagramming and vector drawing software extended with the Target and Circular Diagrams solution from the Marketing area of ConceptDraw Solution Park.
www.conceptdraw.com/ solution-park/ marketing-target-and-circular-diagrams
Arrow loop diagram
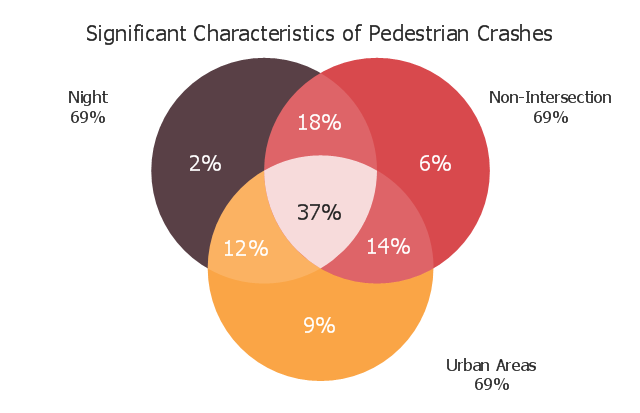
This Venn diagram sample shows the significant characteristics of pedestrian crashes. It was designed on the base of the Venn diagram in the "Pedestrian Safety Strategic Plan: Recommendations for Research and Product Development" from the website of the Federal Highway Administration of the U.S. Department of Transportation. [safety.fhwa.dot.gov/ ped_ bike/ pssp/ fhwasa10035/ ]
"Road traffic safety refers to the methods and measures used to prevent road users from being killed or seriously injured. Typical road users include pedestrians, cyclists, motorists, vehicle passengers, and passengers of on-road public transport (mainly buses and trams).
Best-practices in modern road safety strategies focus on preventing serious injury and death from vehicle crashes despite human fallibility." [Road traffic safety. Wikipedia]
The Venn diagram example "Significant characteristics of pedestrian crashes" was created using the ConceptDraw PRO diagramming and vector drawing software extended with the Venn Diagrams solution from the area "What is a Diagram" of ConceptDraw Solution Park.
Venn diagram
 Cisco Network Diagrams
Cisco Network Diagrams solution extends ConceptDraw PRO software with samples, templates and libraries of vector stencils for drawing the Cisco computer network diagrams.
 ConceptDraw Solution Park
ConceptDraw Solution Park collects graphic extensions, examples and learning materials
- The Diagram Of Safety Equipments
- UML object diagram - Safety inspection | Diagramming Software for ...
- Safety Engineering Analysis
- Entity Relationship Diagram Software for Mac | Entity-Relationship ...
- Safety and Security | Diagramming tool - Amazon Web Services and ...
- Emergency Plan | Safety and Security | UML Tool & UML Diagram ...
- Safety and Security | Entity Relationship Diagram - ERD - Software ...
- Safety and Security | Fishbone Diagrams | Food Court | Fire Safety ...
- UML object diagram - Safety inspection | Diagramming Software for ...
- Fire safety equipment - Vector stencils library | Safety and Security ...
- FTA diagram - Hazard analysis | Accident analytic tree - FTA ...
- Fire Safety Diagram
- Fishbone Diagram Product Safety Example
- Safety Fire Stand Drawing
- Level Diagram Of Safety Department
- Process Flowchart | Fire safety equipment - Vector stencils library ...
- UML Diagram | Entity-Relationship Diagram (ERD) | Safety and ...
- Design elements - Fault tree analysis diagrams | Fault Tree Analysis ...
- Safety Pyramid Diagram
- Stakeholder Onion Diagrams | ConceptDraw Solution Park | Circle ...
- ERD | Entity Relationship Diagrams, ERD Software for Mac and Win
- Flowchart | Basic Flowchart Symbols and Meaning
- Flowchart | Flowchart Design - Symbols, Shapes, Stencils and Icons
- Flowchart | Flow Chart Symbols
- Electrical | Electrical Drawing - Wiring and Circuits Schematics
- Flowchart | Common Flowchart Symbols
- Flowchart | Common Flowchart Symbols