Garrett IA Diagrams with ConceptDraw DIAGRAM

HelpDesk
Event-driven Process Chain (EPC) Diagram Software

An EPC diagram shows different business processes through various workflows. The workflows are seen as functions and events that are connected by different teams or people, as well as tasks that allow business processes to be executed. The best thing about this type of enterprise modeling is that creating an EPC diagram is quick and simple as long as you have the proper tool. One of the main usages of the EPC diagrams is in the modeling, analyzing and re-engineering of business processes. With the use of the flowchart, businesses are able to see inefficiencies in the processes and modify to make them more productive. Event-driven process chain diagrams are also used to configure an enterprise resource plan.
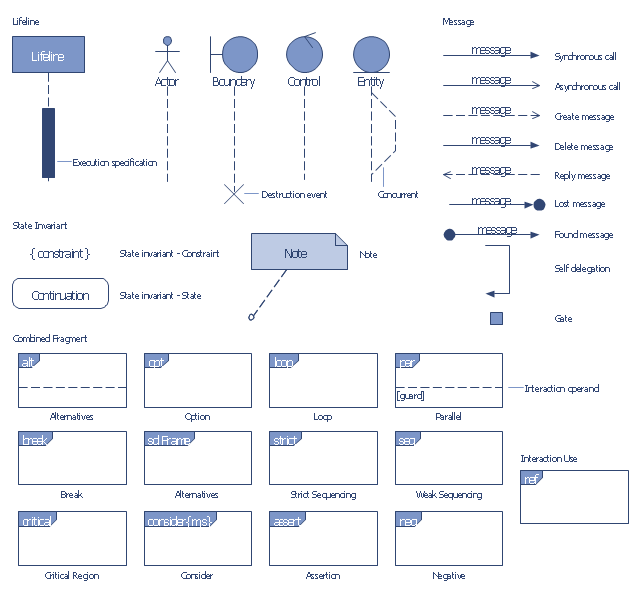
The vector stencils library "Bank UML sequence diagram" contains 34 shapes for drawing UML sequence diagrams.
Use it for object-oriented modeling of your bank information system.
"A sequence diagram shows, as parallel vertical lines (lifelines), different processes or objects that live simultaneously, and, as horizontal arrows, the messages exchanged between them, in the order in which they occur. This allows the specification of simple runtime scenarios in a graphical manner.
Diagram building blocks.
If the lifeline is that of an object, it demonstrates a role. Leaving the instance name blank can represent anonymous and unnamed instances.
Messages, written with horizontal arrows with the message name written above them, display interaction. Solid arrow heads represent synchronous calls, open arrow heads represent asynchronous messages, and dashed lines represent reply messages. ...
Activation boxes, or method-call boxes, are opaque rectangles drawn on top of lifelines to represent that processes are being performed in response to the message (ExecutionSpecifications in UML).
Objects calling methods on themselves use messages and add new activation boxes on top of any others to indicate a further level of processing.
When an object is destroyed (removed from memory), an X is drawn on top of the lifeline, and the dashed line ceases to be drawn below it ...
A message sent from outside the diagram can be represented by a message originating from a filled-in circle (found message in UML) or from a border of the sequence diagram (gate in UML)." [Sequence diagram. Wikipedia]
This example of UML sequence diagram symbols for the ConceptDraw PRO diagramming and vector drawing software is included in the ATM UML Diagrams solution from the Software Development area of ConceptDraw Solution Park.
UML sequence diagram symbols
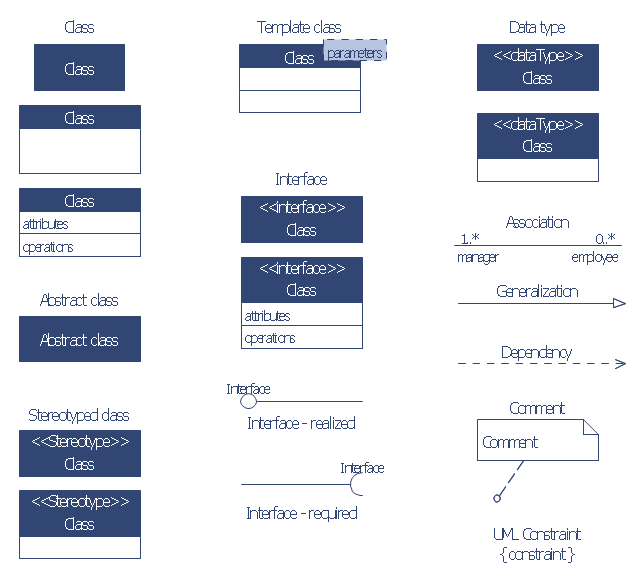
The vector stencils library "Bank UML class diagram" contains 19 shapes for drawing UML class diagrams.
Use it for object-oriented modeling of your bank information system.
"The class diagram is the main building block of object oriented modelling. It is used both for general conceptual modelling of the systematics of the application, and for detailed modelling translating the models into programming code. Class diagrams can also be used for data modeling. The classes in a class diagram represent both the main objects, interactions in the application and the classes to be programmed.
In the diagram, classes are represented with boxes which contain three parts:
* The top part contains the name of the class. It is printed in bold and centered, and the first letter is capitalized.
* The middle part contains the attributes of the class. They are left-aligned and the first letter is lowercase.
* The bottom part contains the methods the class can execute. They are also left-aligned and the first letter is lowercase.
In the design of a system, a number of classes are identified and grouped together in a class diagram which helps to determine the static relations between those objects. With detailed modelling, the classes of the conceptual design are often split into a number of subclasses." [Class diagram. Wikipedia]
This example of UML class diagram symbols for the ConceptDraw PRO diagramming and vector drawing software is included in the ATM UML Diagrams solution from the Software Development area of ConceptDraw Solution Park.
UML class diagram symbols
Bubble diagrams in Landscape Design with ConceptDraw DIAGRAM

- 4 Level pyramid model diagram - Information systems types | 5 Level ...
- Chart Of Management Information System With Diagram
- Information Flow
- Sequence Diagrams For Library Information System
- Uml Diagrams For Library Information System
- Accounting Information Systems Flowchart Symbols | UML ...
- UML Diagram Types List | 4 Level pyramid model diagram ...
- Accounting Information Systems Flowchart Symbols | Basic ...
- 5 Level pyramid model diagram - Information systems types ...
- Pyramid Diagram | 4 Level pyramid model diagram - Information ...
- Library Information System Use Case Diagram
- Deployment Diagram Of Library Information System
- 4 Level pyramid model diagram - Information systems types ...
- Accounting Information Systems Flowchart Symbols | Types of ...
- Components Of Information System Using Diagram
- 4 Level pyramid model diagram - Information systems types | Types ...
- Element Of Information Systems With Diagram
- 4 Level pyramid model diagram - Information systems types | 5 Level ...
- Pyramid Diagram | Pyramid Diagram | Structured Systems Analysis ...
- 5 Level pyramid model diagram - Information systems types | 4 Level ...
- ERD | Entity Relationship Diagrams, ERD Software for Mac and Win
- Flowchart | Basic Flowchart Symbols and Meaning
- Flowchart | Flowchart Design - Symbols, Shapes, Stencils and Icons
- Flowchart | Flow Chart Symbols
- Electrical | Electrical Drawing - Wiring and Circuits Schematics
- Flowchart | Common Flowchart Symbols
- Flowchart | Common Flowchart Symbols