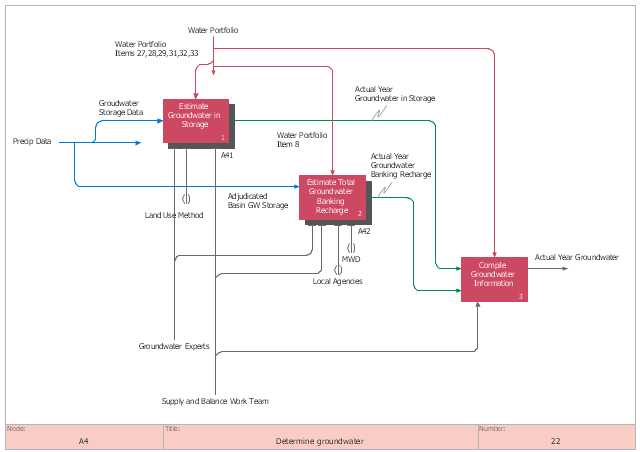
This IDEF0 diagram sample was created on the base of the figure from the California Water Plan website. [waterplan.water.ca.gov/ technical/ cwpu2009/ flowdiaghtml/ dgm18.htm]
"The California Water Plan provides a collaborative planning framework for elected officials, agencies, tribes, water and resource managers, businesses, academia, stakeholders, and the public to develop findings and recommendations and make informed decisions for California's water future. The plan, updated every five years, presents the status and trends of California's water-dependent natural resources; water supplies; and agricultural, urban, and environmental water demands for a range of plausible future scenarios. The California Water Plan also evaluates different combinations of regional and statewide resource management strategies to reduce water demand, increase water supply, reduce flood risk, improve water quality, and enhance environmental and resource stewardship. The evaluations and assessments performed for the plan help identify effective actions and policies for meeting California's resource management objectives in the near term and for several decades to come." [waterplan.water.ca.gov]
The IDEF0 diagram example "Determine groundwater" was created using the ConceptDraw PRO diagramming and vector drawing software extended with the IDEF0 Diagrams solution from the Software Development area of ConceptDraw Solution Park.
IDEF0 diagram
"Consumption of energy resources, (e.g. turning on a light) requires resources and has an effect on the environment. Many electric power plants burn coal, oil or natural gas in order to generate electricity for energy needs. While burning these fossil fuels produces a readily available and instantaneous supply of electricity, it also generates air pollutants including carbon dioxide (CO2), sulfur dioxide and trioxide (SOx) and nitrogen oxides (NOx). Carbon dioxide is an important greenhouse gas which is thought to be responsible for some fraction of the rapid increase in global warming seen especially in the temperature records in the 20th century, as compared with tens of thousands of years worth of temperature records which can be read from ice cores taken in Arctic regions. Burning fossil fuels for electricity generation also releases trace metals such as beryllium, cadmium, chromium, copper, manganese, mercury, nickel, and silver into the environment, which also act as pollutants.
The large-scale use of renewable energy technologies would "greatly mitigate or eliminate a wide range of environmental and human health impacts of energy use". Renewable energy technologies include biofuels, solar heating and cooling, hydroelectric power, solar power, and wind power. Energy conservation and the efficient use of energy would also help." [Energy industry. Environmental impact. Wikipedia]
The Energy resources diagram example was created in the ConceptDraw PRO diagramming and vector drawing software using the Manufacturing and Maintenance solution from the Illustration area of ConceptDraw Solution Park.
Infographics

The vector stencils library "Resources and energy" contains 19 clipart images for drawing illustrations on resources and energy.
"Natural resources occur naturally within environments that exist relatively undisturbed by humanity, in a natural form. A natural resource is often characterized by amounts of biodiversity and geodiversity existent in various ecosystems.
Natural resources are derived from the environment. Some of them are essential for our survival while most are used for satisfying our wants. Natural resources may be further classified in different ways.
Natural resources are materials and components (something that can be used) that can be found within the environment. Every man-made product is composed of natural resources (at its fundamental level). A natural resource may exist as a separate entity such as fresh water, and air, as well as a living organism such as a fish, or it may exist in an alternate form which must be processed to obtain the resource such as metal ores, oil, and most forms of energy." [Natural resource. Wikipedia]
The clip art example "Resources and energy - Vector stencils library" was created in ConceptDraw PRO diagramming and vector drawing software using the Manufacturing and Maintenance solution from the Illustration area of ConceptDraw Solution Park.
Human resources

Batteries

Wind turbine

Transmission tower

Natural gas burner

Solar panel

Lightning

Ionizing radiation hazard sign

High voltage symbol

Atom

Incandescent light bulb

Oil barrels

Power station

Wood

Perpetuum mobile

Hydroelectric dam

Liquefied petroleum gas

Natural gas

Minecart with coal

Bar Diagram Math

UK Map

ConceptDraw PRO diagramming and vector drawing software offers the unique Map of UK Solution from the Maps Area of ConceptDraw Solution Park that is indispensable for easy drawing professional looking map of UK, UK counties map, UK map with cities, map of Scotland, map of England, map of Wales, Northern Ireland map.
Computer Network Architecture. Computer and Network Examples


Process Diagrams

Affinity Diagram

Types of Flowcharts


Pyramid Chart Examples

 Basic Divided Bar Diagrams
This solution extends the capabilities of ConceptDraw PRO v10.3.0 (or later) with templates, samples and a library of vector stencils for drawing Divided Bar diagrams.
Work Flow Process Chart

How to Draw a Good Diagram of a Business Workflow?

 Chemical and Process Engineering
This chemical engineering solution extends ConceptDraw PRO v.9.5 (or later) with process flow diagram symbols, samples, process diagrams templates and libraries of design elements for creating process and instrumentation diagrams, block flow diagrams (BFD
- Examples Of Natural Resources Graph Pic
- Natural Resources Diagrams
- UK Map | Hiring Process | Bar Diagram Math | Natural Resources ...
- UK Map | UK Map | Bar Diagram Math | 3 Examples Of Natural ...
- Natural Resource Topic And Diagram
- Resources and energy - Vector stencils library | Energy Pyramid ...
- Natural Resource Example Pictures
- Diagrams Of Natural Resources
- Natural Resources Flow Chat
- Natural Resource Diagrams Images And Graphs
- Bar Graphs And Pie Charts Natural Resources
- Natural Resources Diagram
- Natural Resources And Human Resources Diagram
- Natural Resources Bar Graph Maths
- Process Flowchart | Energy resources diagram | Types of Flowcharts ...
- Flow Chat Classification Of Natural Resources And Human Resources
- Classification Of Natural Resources Diagram
- Example Of Natural Resources
- Natural Resources Bar Graph
- Make A Flow Chart Classifying Various Natural Resources With
- ERD | Entity Relationship Diagrams, ERD Software for Mac and Win
- Flowchart | Basic Flowchart Symbols and Meaning
- Flowchart | Flowchart Design - Symbols, Shapes, Stencils and Icons
- Flowchart | Flow Chart Symbols
- Electrical | Electrical Drawing - Wiring and Circuits Schematics
- Flowchart | Common Flowchart Symbols
- Flowchart | Common Flowchart Symbols