A five level pyramid model of different types of Information Systems based on the information processing requirement of different levels in the organization. The first level represents transaction processing systems to process basic data. The second level represents office support systems to process information in office. The third level represents management information systems to process information by managers. The fourth level represents decision support systems to process explicit knowledge. The fifth level represents executive information systems to process tacit knowledge.
"A Computer(-Based) Information System is essentially an IS using computer technology to carry out some or all of its planned tasks. The basic components of computer based information system are:
(1) Hardware - these are the devices like the monitor, processor, printer and keyboard, all of which work together to accept, process, show data and information.
(2) Software - are the programs that allow the hardware to process the data.
(3) Databases - are the gathering of associated files or tables containing related data.
(4) Networks - are a connecting system that allows diverse computers to distribute resources.
(5) Procedures - are the commands for combining the components above to process information and produce the preferred output.
The first four components (hardware, software, database and network) make up what is known as the information technology platform. Information technology workers could then use these components to create information systems that watch over safety measures, risk and the management of data. These actions are known as information technology services." [Information systems. Wikipedia]
This pyramid diagram was redesigned using the ConceptDraw PRO diagramming and vector drawing software from Wikimedia Commons file Five-Level-Pyramid-model.png. [commons.wikimedia.org/ wiki/ File:Five-Level-Pyramid-model.png]
This file is licensed under the Creative Commons Attribution 3.0 Unported license. [creativecommons.org/ licenses/ by/ 3.0/ deed.en]
The triangle chart example "Information systems types" is included in the Pyramid Diagrams solution from the Marketing area of ConceptDraw Solution Park.
Pyramid diagram

Control and Information Architecture Diagrams (CIAD) with ConceptDraw PRO

A four level pyramid model of different types of Information Systems based on the different levels of hierarchy in an organization. The first level represents transaction processing systems for workers. The second level represents management information systems for middle managers. The third level represents decision support systems for senior menegers. The fourth level represents executive information systems for executives.
"The "classic" view of Information systems found in the textbooks in the 1980s was of a pyramid of systems that reflected the hierarchy of the organization, usually transaction processing systems at the bottom of the pyramid, followed by management information systems, decision support systems, and ending with executive information systems at the top. Although the pyramid model remains useful, since it was first formulated a number of new technologies have been developed and new categories of information systems have emerged, some of which no longer fit easily into the original pyramid model.
Some examples of such systems are:
data warehouses,
enterprise resource planning,
enterprise systems,
expert systems,
search engines,
geographic information system,
global information system,
office automation." [Information systems. Wikipedia]
This diagram was redesigned using the ConceptDraw PRO diagramming and vector drawing software from Wikimedia Commons file Four-Level-Pyramid-model.png. [commons.wikimedia.org/ wiki/ File:Four-Level-Pyramid-model.png]
This file is licensed under the Creative Commons Attribution-Share Alike 3.0 Unported license. [creativecommons.org/ licenses/ by-sa/ 3.0/ deed.en]
The triangle chart example "Information systems types" is included in the Pyramid Diagrams solution from the Marketing area of ConceptDraw Solution Park.
Pyramid diagram

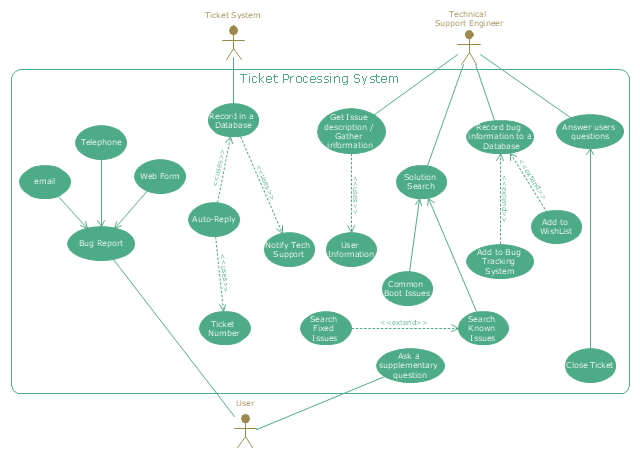
"An example scenario is presented to demonstrate how a common issue tracking system would work:
(1) A customer service technician receives a telephone call, email, or other communication from a customer about a problem. Some applications provide built-in messaging system and automatic error reporting from exception handling blocks.
(2) The technician verifies that the problem is real, and not just perceived. The technician will also ensure that enough information about the problem is obtained from the customer. This information generally includes the environment of the customer, when and how the issue occurs, and all other relevant circumstances.
(3) The technician creates the issue in the system, entering all relevant data, as provided by the customer.
(4) As work is done on that issue, the system is updated with new data by the technician. Any attempt at fixing the problem should be noted in the issue system. Ticket status most likely will be changed from open to pending.
(5) After the issue has been fully addressed, it is marked as resolved in the issue tracking system.
If the problem is not fully resolved, the ticket will be reopened once the technician receives new information from the customer. A Run Book Automation process that implements best practices for these workflows and increases IT personnel effectiveness is becoming very common." [Issue tracking system. Wikipedia]
The UML use case diagram example "Ticket processing system" was created using the ConceptDraw PRO diagramming and vector drawing software extended with the Rapid UML solution from the Software Development area of ConceptDraw Solution Park.
UML use case diagram
 Business Processes
Business Process solution extends ConceptDraw PRO software with business process diagrams as cross-functional flowcharts, workflows, process charts, IDEF0, timelines, calendars, Gantt charts, business process modeling, audit and opportunity flowcharts.
 Event-driven Process Chain Diagrams
Event-driven Process Chain (EPC) Diagram is a type of flowchart widely used for modeling in business engineering and reengineering, business process improvement, and analysis. EPC method was developed within the Architecture of Integrated Information Systems (ARIS) framework.
IDEF3 Standard

- 5 level pyramid model diagram of information systems types ...
- Pyramid Diagram
- 5 level pyramid model diagram of information systems types
- 3 level pyramid model diagram of information systems types | 5 level ...
- Pyramid Diagram | Pyramid Diagram | 5 level pyramid model ...
- 5 level pyramid model diagram of information systems types | 3 level ...
- Pyramid Diagram
- Pyramid Diagram | 5 level pyramid model diagram of information ...
- 3 level pyramid model diagram of information systems types | 4 level ...
- 5 level pyramid model diagram of information systems types | 4 level ...
- Pyramid Diagram | Account Flowchart Stockbridge System ...
- 3 level pyramid model diagram of information systems types | 5 level ...
- Diagrammatic Representation Of Information Processing System
- 4 level pyramid model diagram of information systems types ...
- Data Flow Diagrams
- Types of Flowchart - Overview | Process Flowchart | Pyramid ...
- How to Create Flowcharts for an Accounting Information System ...
- Pyramid Diagram | Pyramid Chart Examples | Block diagram - Five ...
- Pyramid Diagram | 4 Level pyramid model diagram - Information ...
- Pyramid Diagram | 5-level 3D pyramid diagram template | Pyramid ...
- ERD | Entity Relationship Diagrams, ERD Software for Mac and Win
- Flowchart | Basic Flowchart Symbols and Meaning
- Flowchart | Flowchart Design - Symbols, Shapes, Stencils and Icons
- Flowchart | Flow Chart Symbols
- Electrical | Electrical Drawing - Wiring and Circuits Schematics
- Flowchart | Common Flowchart Symbols
- Flowchart | Common Flowchart Symbols