HelpDesk
How to Draw Geometric Shapes in ConceptDraw PRO
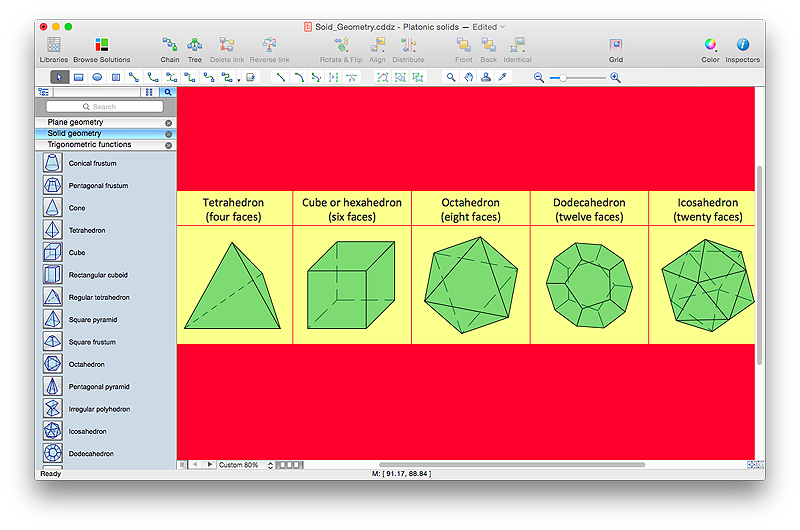
Knowledge of geometry grants people good logic, abstract and spatial thinking skills. The object of study of geometry are the size, shape and position, the 2-dimensional and 3-dimensional shapes. Geometry is related to many other areas in math, and is used daily by engineers, architects, designers and many other professionals. Today, the objects of geometry are not only shapes and solids. It deals with properties and relationships and looks much more about analysis and reasoning. Geometry drawings can be helpful when you study the geometry, or need to illustrate the some investigation related to geometry. ConceptDraw PRO allows you to draw plane and solid geometry shapes quickly and easily.Basic Flowchart Symbols and Meaning
Flowchart Symbols and Meaning - Provides a visual representation of basic flowchart symbols and their proposed use in professional workflow diagram, standard process flow diagram and communicating the structure of a well-developed web site, as well as their correlation in developing on-line instructional projects. See flowchart's symbols by specifics of process flow diagram symbols and workflow diagram symbols.
Basic Diagramming
Mathematical Drawing Software - Draw mathematical illustration diagrams easily from examples and templates!
 Accounting Flowcharts
Accounting Flowcharts solution extends ConceptDraw PRO software with templates, samples and library of vector stencils for drawing the accounting flow charts.
 Mathematics
Mathematics solution extends ConceptDraw PRO software with templates, samples and libraries of vector stencils for drawing the mathematical illustrations, diagrams and charts.
Horizontal Flowchart
This sample was created in ConceptDraw PRO diagramming and vector drawing software using the Flowcharts solution from the Diagrams area of ConceptDraw Solution Park.A Flowchart is a graphically representation of the process, algorithm or the step-by-step solution of the problem. The Flowcharts have one or more starting and ending points. The geometric figures on the Flowcharts represent the steps of the process and are connected with arrows that show the sequence of the actions.
Flowchart of Products. Flowchart Examples
This sample shows the Flowchart of the Sustainment and Disposal.A Flowchart is a graphically representation of the process that step-by-step lead to the solution the problem. The geometric figures on the Flowchart represent the steps of the process and are connected with arrows that show the sequence of the actions. The Flowcharts are widely used in engineering, architecture, science, analytics, government, politics, business, marketing, manufacturing, administration, etc.
HelpDesk
How to Reshape an Object Using Vertex Tool on Mac
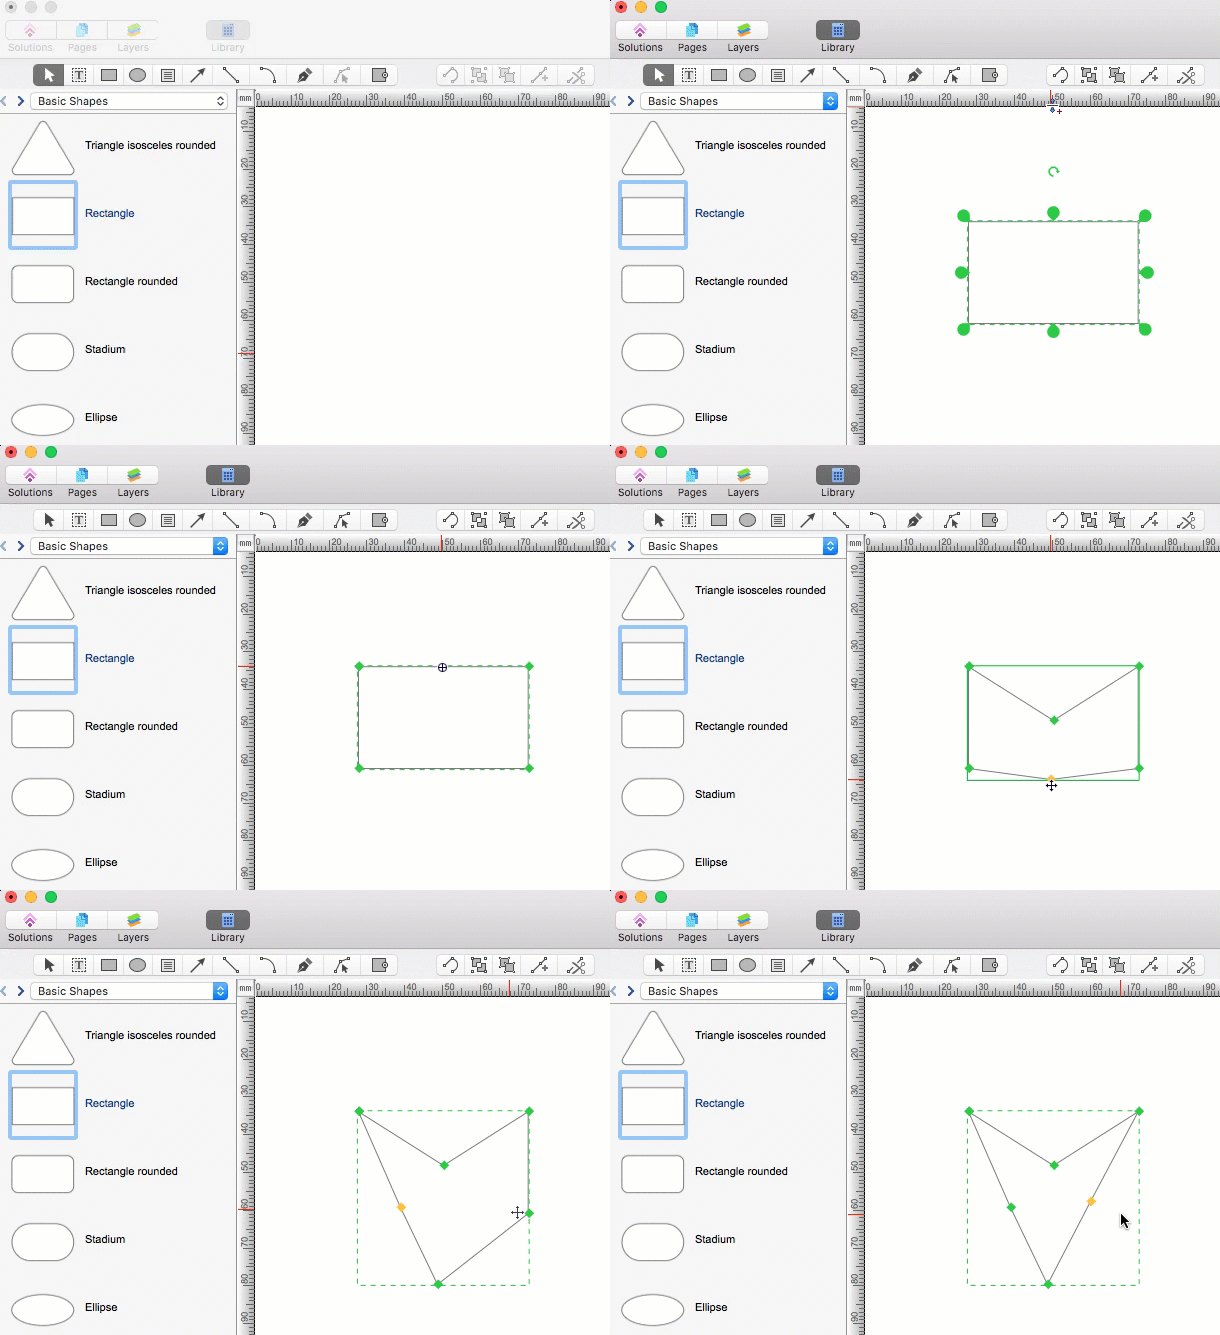
Create your own custom objects using the elements of Basic Shapes library. To create complex objecrts or change existing ones in ConceptDraw PRO , you can usethe Vertex tool. Using vertexes you can modify the geometry of any object in ConceptDraw PRO.
Sample Project Flowchart. Flowchart Examples
This sample shows the Flowchart that displays the architecture of SQL Exception Translation.This sample was created in ConceptDraw PRO diagramming and vector drawing software using the Flowcharts solution from the Diagrams area of ConceptDraw Solution Park.

Types of Flowchart - Overview
When designing a process or an instruction in clear way, you should consider creating a flowchart. A Process Flow Diagram is the method. You can avoid wasting a lot of time understanding complex concepts as they get clear with different diagrams.
Types of Welding in Flowchart
This sample was created in ConceptDraw PRO diagramming and vector drawing software using the Flowcharts solution from the Diagrams area of ConceptDraw Solution Park.This sample shows the Flowchart that displays the solid-state welding processes, the types of welding.
Types of Flowcharts
A Flowchart is a graphically representation of the process, algorithm or the step-by-step solution of the problem. There are ten types of Flowcharts. Using the Flowcharts solution from the Diagrams area of ConceptDraw Solution Park you can easy and quickly design the Flowchart of any of these types.
UML Notation
Unified Modeling Language (UML) is a language of graphic description for object modeling in the field of software engineering. UML was created for definition, visualization, designing of software systems. UML is an open standard that uses graphic notations for creating visual models of object-oriented software systems.Two types of diagrams are used in UML: Structure Diagrams and Behavior Diagrams. Behavior Diagrams represent the processes proceeding in a modeled environment. Structure Diagrams represent the elements that compose the system.
Software Diagrams
Design and document development of projects using a wide range of pre-drawn shapes and smart connectors. Develop visualization solutions with the help of the built-in scripting language.ConceptDraw PRO is a perfect tool for Designing and planning tasks; Developing Visualization Solutions; Project Planning (Gantt Charts, Timelines, Project Schedules).
- Diagrams Of Geometric Shapes Relevant To Accounting
- Diagram Of Geometric Shapes
- Diagrams Of Mathematical Shapes
- Types Of Shapes In Geometry
- How to Draw Geometric Shapes in ConceptDraw PRO ...
- Diagram Drawn By Using Different Geometrical Shapes
- How to Draw Geometric Shapes in ConceptDraw PRO ...
- Math Solutions Concept Map
- Mathematics Symbols | Mathematical Diagrams | How to Draw ...
- How to Draw Geometric Shapes in ConceptDraw PRO | | Basic ...
- Basic Diagramming | Mathematics | Accounting Flowcharts ...
- Bar Diagram Math | Math illustrations - Template | Basic ...
- Types of Flowchart - Overview | Bar Diagram Math | Total Quality ...
- Math Topics Flow Chart Examples
- Basic Diagramming | Mathematics | | Flowcharts About Mathematics
- Types of Flowchart - Overview | How to Create a Venn Diagram in ...
- Basic Diagramming | Euclidean algorithm - Flowchart | Accounting ...
- How to Draw Geometric Shapes in ConceptDraw PRO ...
- How to Draw Geometric Shapes in ConceptDraw PRO ...
- How to Draw Geometric Shapes in ConceptDraw PRO ...
- ERD | Entity Relationship Diagrams, ERD Software for Mac and Win
- Flowchart | Basic Flowchart Symbols and Meaning
- Flowchart | Flowchart Design - Symbols, Shapes, Stencils and Icons
- Flowchart | Flow Chart Symbols
- Electrical | Electrical Drawing - Wiring and Circuits Schematics
- Flowchart | Common Flowchart Symbols
- Flowchart | Common Flowchart Symbols


