"An issue tracking system (also ITS, trouble ticket system, support ticket, request management or incident ticket system) is a computer software package that manages and maintains lists of issues, as needed by an organization. Issue tracking systems are commonly used in an organization's customer support call center to create, update, and resolve reported customer issues, or even issues reported by that organization's other employees. An issue tracking system often also contains a knowledge base containing information on each customer, resolutions to common problems, and other such data. An issue tracking system is similar to a "bugtracker", and often, a software company will sell both, and some bugtrackers are capable of being used as an issue tracking system, and vice versa. Consistent use of an issue or bug tracking system is considered one of the "hallmarks of a good software team".
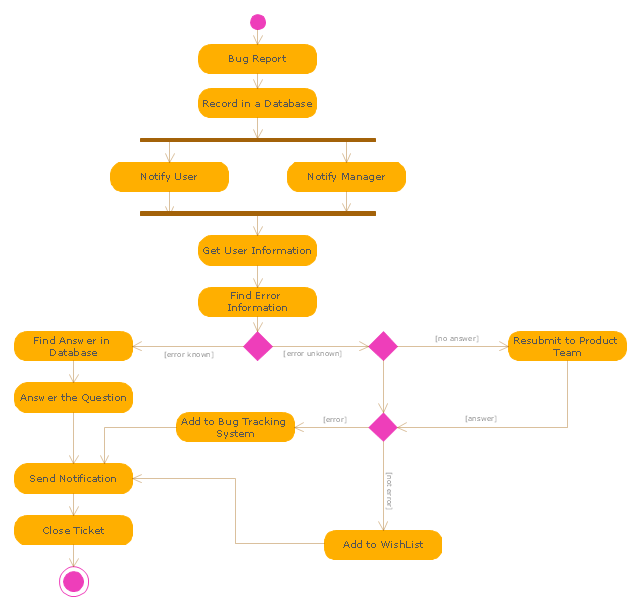
A ticket element, within an issue tracking system, is a running report on a particular problem, its status, and other relevant data. They are commonly created in a help desk or call center environment and almost always have a unique reference number, also known as a case, issue or call log number which is used to allow the user or help staff to quickly locate, add to or communicate the status of the user's issue or request.
These tickets are so called because of their origin as small cards within a traditional wall mounted work planning system when this kind of support started. Operators or staff receiving a call or query from a user would fill out a small card with the user's details and a brief summary of the request and place it into a position (usually the last) in a column of pending slots for an appropriate engineer, so determining the staff member who would deal with the query and the priority of the request." [Issue tracking system. Wikipedia]
The UML activity diagram example "Ticket processing system" was created using the ConceptDraw PRO diagramming and vector drawing software extended with the Rapid UML solution from the Software Development area of ConceptDraw Solution Park.
UML activity diagram
HelpDesk
How to Create an Interactive Voice Response (IVR) Diagram in ConceptDraw PRO
 diagram")
 Business Process Diagrams
Business Process Diagrams solution extends the ConceptDraw PRO BPM software with RapidDraw interface, templates, samples and numerous libraries based on the BPMN 1.2 and BPMN 2.0 standards, which give you the possibility to visualize equally easy simple and complex processes, to design business models, to quickly develop and document in details any business processes on the stages of project’s planning and implementation.
Process Flowchart


"Dimensions of service quality.
A customer's expectation of a particular service is determined by factors such as recommendations, personal needs and past experiences. The expected service and the perceived service sometimes may not be equal, thus leaving a gap. The service quality model or the ‘GAP model’ developed by a group of authors- Parasuraman, Zeithaml and Berry at Texas and North Carolina in 1985 , highlights the main requirements for delivering high service quality. It identifies five ‘gaps’ that cause unsuccessful delivery. Customers generally have a tendency to compare the service they 'experience' with the service they 'expect' . If the experience does not match the expectation , there arises a gap. Ten determinants that may influence the appearance of a gap were described by Parasuraman, Zeithaml and Berry. in the SERVQUAL model: reliability, responsiveness, competence, access, courtesy, communication, credibility, security, understanding the customer and tangibles.
Later, the determinants were reduced to five: tangibles; reliability; responsiveness; service assurance and empathy in the so called RATER model." [Service quality. Wikipedia]
The block diagram example "Gap model of service quality" was created using the ConceptDraw PRO diagramming and vector drawing software extended with the Block Diagrams solution from the area "What is a Diagram" of ConceptDraw Solution Park.
Block diagram

 Interactive Voice Response Diagrams
Interactive Voice Response Diagrams solution extends ConceptDraw PRO v10 software with samples, templates and libraries of ready-to-use vector stencils that help create Interactive Voice Response (IVR) diagrams illustrating in details a work of interactive voice response system, the IVR system’s logical and physical structure, Voice-over-Internet Protocol (VoIP) diagrams, and Action VoIP diagrams with representing voice actions on them, to visualize how the computers interact with callers through voice recognition and dual-tone multi-frequency signaling (DTMF) keypad inputs.
Taxi Service Data Flow Diagram DFD Example

Basic Flowchart Symbols and Meaning


Workflow Diagram Symbols

This marketing diagram sample illustrates leaky bucket model.
"The leaky bucket theory. The leaky bucket theory is the model that seeks to describe the process of customer gain and loss, otherwise known as customer churn. Customer retention is one of the key concepts in relationship marketing. Most companies concentrate on recruiting new customers to replace customers who move on, rather than seeking to retain customers." [Blythe J. Key Concepts in Marketing. 2009. knowledge.sagepub.com/ view/ key-concepts-in-marketing/ n5.xml]
"Customer attrition, also known as customer churn, customer turnover, or customer defection, is the loss of clients or customers.
Banks, telephone service companies, Internet service providers, pay TV companies, insurance firms, and alarm monitoring services, often use customer attrition analysis and customer attrition rates as one of their key business metrics (along with cash flow, EBITDA, etc.) because the "...cost of retaining an existing customer is far less than acquiring a new one." Companies from these sectors often have customer service branches which attempt to win back defecting clients, because recovered long-term customers can be worth much more to a company than newly recruited clients." [Customer attrition. Wikipedia]
The chart example "Leaky bucket diagram" was created using the ConceptDraw PRO diagramming and vector drawing software extended with the Marketing Diagrams solution from the Marketing area of ConceptDraw Solution Park.
Marketing chart

BPR Diagram. Business Process Reengineering Example

The vector stencils library "Workflow diagrams" contains 54 symbol icons of workflow diagrams.
The workflow diagrams represent information flow, automation of business processes, business process re-engineering, accounting, management, and human resources tasks in industry, business, and manufacturing.
Use this library to draw workflow diagrams in the ConceptDraw PRO diagramming and vector drawing software extended with the Workflow Diagrams solution from the Business Processes area of ConceptDraw Solution Park.
www.conceptdraw.com/ solution-park/ business-process-workflow-diagrams
Accounting

Accounts Payable

Accounts Receivable

Bank

Board of Directors

Copy Center

Customer Service

Distribution

Finance

Information Systems

International Division

International Marketing

International Sales

Inventory

Legal Department

Mailroom 2

Mailroom 1

Management

Manufacturing

Marketing

Motor Pool

Packaging

Payroll

Person 1

Person 2

Personnel/ Staff

Publications

Purchasing

Quality Assurance

Exchange

Reception

Research and Development

Sale contract

Shipping

Suppliers

Telecommunications

Treasurer

Warehouse

Lorry

Quality

Production

Box

Boxes

Open box

Payment

Receiving

Sales

Phone

Operator 1

Online booking

Operator 2

Server

Car

Mini truck

 Event-driven Process Chain Diagrams
Event-driven Process Chain (EPC) Diagram is a type of flowchart widely used for modeling in business engineering and reengineering, business process improvement, and analysis. EPC method was developed within the Architecture of Integrated Information Systems (ARIS) framework.
UML Use Case Diagram Example Registration System

This sample shows the types of user’s interactions with the system and is used at the registration and working with the database system.
- Uml Diagrams For Customer Support System
- Customer Support System Class Diagram Diagram
- Fishbone Diagram For Customer Service
- Customer Support System Uml Diagrams
- Customer Service Workflow Diagram
- Customer Service Tree Diagram
- Sequence Diagram For Customer Support System
- Customer Support Diagram
- Component Diagram For Customer Support System
- Diagram Of Customer Service Bank
- Customer Service Diagrams And Charts
- Data Flow Diagram For Customer Service System
- Fishbone Diagram Bad Customer Service Fishbone Diagram Bad
- Draw A Diagram That Illustrates The Chain Of Customer Service
- Class Diagram For Customer Support System
- Activity Diagram For Customer Support System
- Bpmn Diagram For Customer Support
- System Sequence Diagram For Customer Support System
- Statechart Diagram For Customer Support System
- Data Flow Diagram Customer Complaint
- ERD | Entity Relationship Diagrams, ERD Software for Mac and Win
- Flowchart | Basic Flowchart Symbols and Meaning
- Flowchart | Flowchart Design - Symbols, Shapes, Stencils and Icons
- Flowchart | Flow Chart Symbols
- Electrical | Electrical Drawing - Wiring and Circuits Schematics
- Flowchart | Common Flowchart Symbols
- Flowchart | Common Flowchart Symbols