Sentence Diagrammer

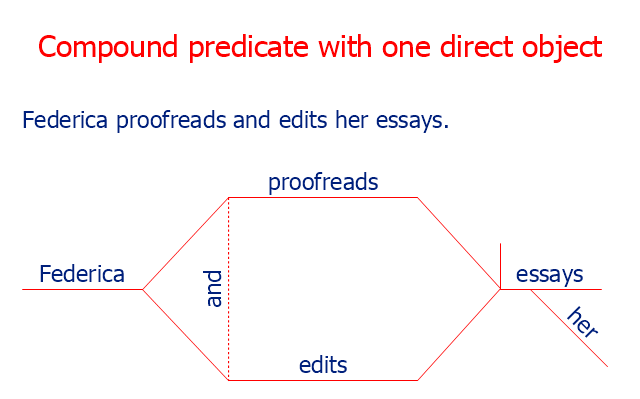
"There are two competing notions of the predicate in theories of grammar. The first concerns traditional grammar, which tends to view a predicate as one of two main parts of a sentence, the other part being the subject; the purpose of the predicate is to modify the subject. The second derives from work in predicate calculus (predicate logic, first order logic) and is prominent in modern theories of syntax and grammar. In this approach, the predicate of a sentence corresponds mainly to the main verb and any auxiliaries that accompany the main verb, whereas the arguments of that predicate (e.g. the subject and object noun phrases) are outside the predicate." [Predicate (grammar). Wikipedia]
The sentence diagram example "Compound predicate with one direct object" was created using the ConceptDraw PRO diagramming and vector drawing software extended with the Language Learning solution from the Science and Education area of ConceptDraw Solution Park.
The sentence diagram example "Compound predicate with one direct object" was created using the ConceptDraw PRO diagramming and vector drawing software extended with the Language Learning solution from the Science and Education area of ConceptDraw Solution Park.
Sentence diagram
 Education
This solution extends ConceptDraw PRO and ConceptDraw MINDMAP with specific content that helps illustrate educational documents, presentations, and websites quickly and easily with astronomy, chemistry, math and physics vector pictures and clip art.
This sentence diagram example was redesigned from the Wikipedia file: Examples of Reed-Kellogg diagrams.jpg.
[en.wikipedia.org/ wiki/ File:Examples_ of_ Reed-Kellogg_ diagrams.jpg]
This file is licensed under the Creative Commons Attribution-Share Alike 3.0 Unported license. [creativecommons.org/ licenses/ by-sa/ 3.0/ deed.en]
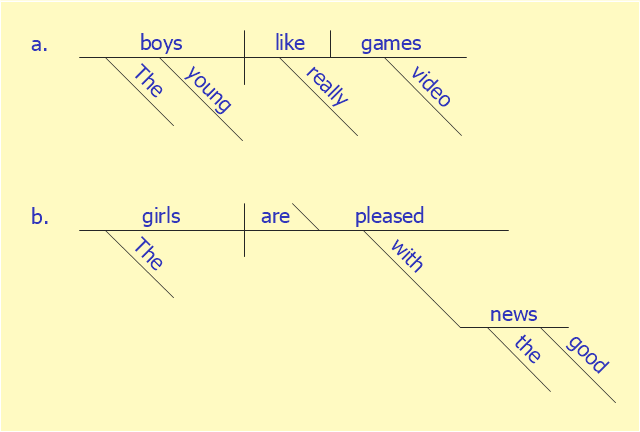
"Most methods of diagramming in pedagogy are based on the work of Alonzo Reed and Brainerd Kellogg in their book Higher Lessons in English, first published in 1877, though the method has been updated with recent understanding of grammar. Reed and Kellogg were preceded, and their work probably informed, by W. S. Clark, who published his "balloon" method of depicting grammar in his 1847 book A Practical Grammar: In Which Words, Phrases & Sentences are Classified According to Their Offices and Their Various Relationships to Each Another.
Some schoolteachers continue to use the Reed-Kellogg system in teaching grammar, but others have discouraged it in favor of more modern tree diagrams. However, these modern tree structures draw on techniques that were already present in Reed-Kellogg diagrams. Reed and Kellogg defend their system in the preface to their grammar:
The Objections to the Diagram. - The fact that the pictorial diagram groups the parts of a sentence according to their offices and relations, and not in the order of speech, has been spoken of as a fault. It is, on the contrary, a merit, for it teaches the pupil to look through the literary order and discover the logical order. He thus learns what the literary order really is, and sees that this may be varied indefinitely, so long as the logical relations are kept clear.
The assertion that correct diagrams can be made mechanically is not borne out by the facts. It is easier to avoid precision in oral analysis than in written. The diagram drives the pupil to a most searching examination of the sentence, brings him face to face with every difficulty, and compels a decision on every point.
These statements bear witness to the fact that Reed-Kellogg diagrams abstract away from actual word order in order to focus more intently on how words in sentences function and relate to each other." [Sentence diagram. Wikipedia]
The examples of Reed-Kellogg diagrams was created using the ConceptDraw PRO diagramming and vector drawing software extended with the Language Learning solution from the Science and Education area of ConceptDraw Solution Park.
[en.wikipedia.org/ wiki/ File:Examples_ of_ Reed-Kellogg_ diagrams.jpg]
This file is licensed under the Creative Commons Attribution-Share Alike 3.0 Unported license. [creativecommons.org/ licenses/ by-sa/ 3.0/ deed.en]
"Most methods of diagramming in pedagogy are based on the work of Alonzo Reed and Brainerd Kellogg in their book Higher Lessons in English, first published in 1877, though the method has been updated with recent understanding of grammar. Reed and Kellogg were preceded, and their work probably informed, by W. S. Clark, who published his "balloon" method of depicting grammar in his 1847 book A Practical Grammar: In Which Words, Phrases & Sentences are Classified According to Their Offices and Their Various Relationships to Each Another.
Some schoolteachers continue to use the Reed-Kellogg system in teaching grammar, but others have discouraged it in favor of more modern tree diagrams. However, these modern tree structures draw on techniques that were already present in Reed-Kellogg diagrams. Reed and Kellogg defend their system in the preface to their grammar:
The Objections to the Diagram. - The fact that the pictorial diagram groups the parts of a sentence according to their offices and relations, and not in the order of speech, has been spoken of as a fault. It is, on the contrary, a merit, for it teaches the pupil to look through the literary order and discover the logical order. He thus learns what the literary order really is, and sees that this may be varied indefinitely, so long as the logical relations are kept clear.
The assertion that correct diagrams can be made mechanically is not borne out by the facts. It is easier to avoid precision in oral analysis than in written. The diagram drives the pupil to a most searching examination of the sentence, brings him face to face with every difficulty, and compels a decision on every point.
These statements bear witness to the fact that Reed-Kellogg diagrams abstract away from actual word order in order to focus more intently on how words in sentences function and relate to each other." [Sentence diagram. Wikipedia]
The examples of Reed-Kellogg diagrams was created using the ConceptDraw PRO diagramming and vector drawing software extended with the Language Learning solution from the Science and Education area of ConceptDraw Solution Park.
Sentence diagram
Concept Map

How to draw a Concept Map quick, easy and effective? ConceptDraw PRO offers the unique Concept Maps Solution from the "Diagrams" Area that will help you!
What Is a Concept Map

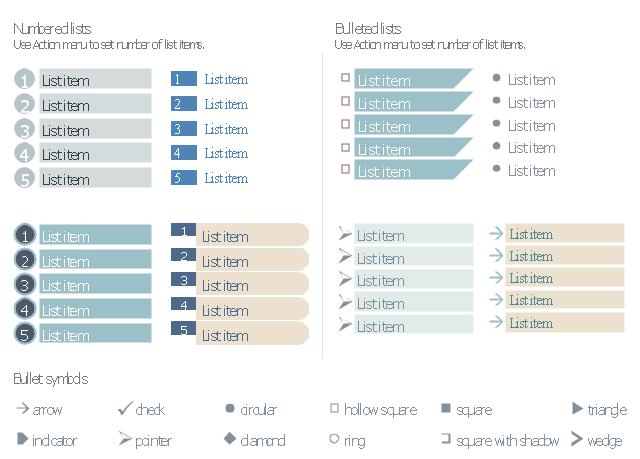
The vector stencils library "Management list blocks" contains 20 list block shapes: numbered list, bulleted list, bullets.
Use these list elements to design your management infograms.
"In typography, a bullet is a typographical symbol or glyph used to introduce items in a list. ...
The bullet symbol may take any of a variety of shapes, such as circular, square, diamond, arrow, etc. ...
Bullets are most often used in technical writing, reference works, notes and presentations. ...
Bulleted items – known as "bullet points" – may be short phrases, single sentences, or of paragraph length. Bulleted items are not usually terminated with a full stop if they are not complete sentences, although it is not rare to terminate every item except the last one with a semicolon, and terminate the last item with a full stop. It is correct to terminate a bullet point with a full stop if the text within that item consists of one 'full' sentence or more." [Bullet (typography). Wikipedia]
The shapes example "Design elements - Management list blocks" was created using the ConceptDraw PRO diagramming and vector drawing software extended with the Management Infographics solition from the area "Business Infographics" in ConceptDraw Solution Park.
Numbered lists, bulleted lists, bullets
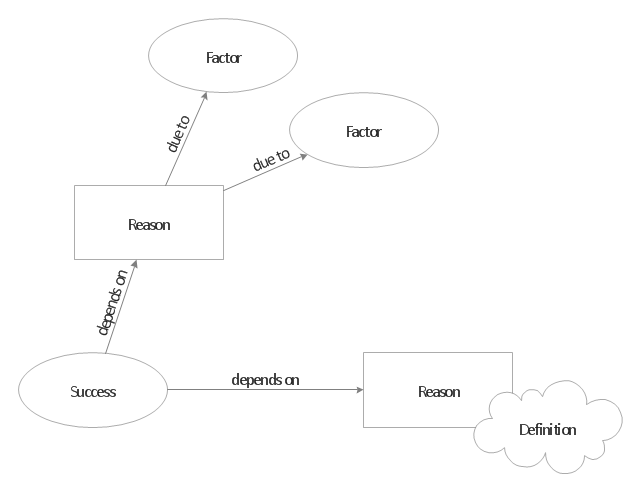
"A concept map is a diagram that depicts suggested relationships between concepts. It is a graphical tool that designers, engineers, technical writers, and others use to organize and structure knowledge. A concept map typically represents ideas and information as boxes or circles, which it connects with labeled arrows in a downward-branching hierarchical structure. The relationship between concepts can be articulated in linking phrases such as causes, requires, or contributes to. The technique for visualizing these relationships among different concepts is called concept mapping. Concept maps define the ontology of computer systems, for example with the object role modeling or Unified Modeling Language formalism." [Concept map. Wikipedia]
The concept map template for the ConceptDraw PRO diagramming and vector drawing software is included in the Concept Maps solution from the area "What is a Diagram" of ConceptDraw Solution Park.
The concept map template for the ConceptDraw PRO diagramming and vector drawing software is included in the Concept Maps solution from the area "What is a Diagram" of ConceptDraw Solution Park.
Concept map template
The vector stencils library "Management pictograms" contains 72 ideograms. Use this flat icon set to design your management infograms.
"An ideogram or ideograph is a graphic symbol that represents an idea or concept, independent of any particular language, and specific words or phrases. Some ideograms are comprehensible only by familiarity with prior convention; others convey their meaning through pictorial resemblance to a physical object, and thus may also be referred to as pictograms." [Ideogram. Wikipedia]
The ideogram example "Design elements - Management pictograms" was created using the ConceptDraw PRO diagramming and vector drawing software extended with the Management Infographics solition from the area "Business Infographics" in ConceptDraw Solution Park.
Management pictograms

Venn Diagram Examples for Problem Solving. Computer Science. Chomsky Hierarchy

The Venn diagram example below visualizes the the class of language inclusions described by the Chomsky hierarchy.
Basic Flowchart Symbols and Meaning


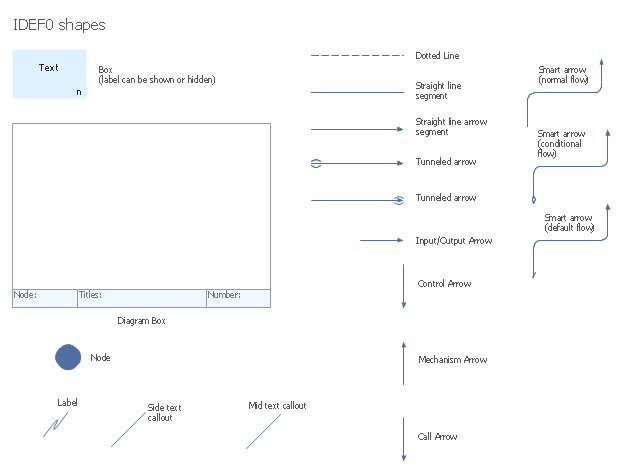
The vector stencils library "IDEF0 diagrams" contains 18 symbols for drawing IDEF0 function modeling diagrams using the ConceptDraw PRO diagramming and vector drawing software.
"The IDEF0 model ... is based on a simple syntax. Each activity is described by a verb-based label placed in a box. Inputs are shown as arrows entering the left side of the activity box while output are shown as exiting arrows on the right side of the box. Controls are displayed as arrows entering the top of the box and mechanisms are displayed as arrows entering from the bottom of the box. Inputs, Controls, Outputs, and Mechanisms are all referred to as concepts.
- Arrow : A directed line, composed of one or more arrow segments, that models an open channel or conduit conveying data or objects from source (no arrowhead) to use (with arrowhead). There are 4 arrow classes: Input Arrow, Output Arrow, Control Arrow, and Mechanism Arrow (includes Call Arrow). See Arrow Segment, Boundary Arrow, Internal Arrow.
- Box : A rectangle, containing a name and number, used to represent a function.
- Context : The immediate environment in which a function (or set of functions on a diagram) operates.
- Decomposition : The partitioning of a modeled function into its component functions.
- Fork : The junction at which an IDEF0 arrow segment (going from source to use) divides into two or more arrow segments. May denote unbundling of meaning.
- Function : An activity, process, or transformation (modeled by an IDEF0 box) identified by a verb or verb phrase that describes what must be accomplished.
- Join : The junction at which an IDEF0 arrow segment (going from source to use) merges with one or more other arrow segments to form a single arrow segment. May denote bundling of arrow segment meanings.
- Node : A box from which child boxes originate; a parent box. See Node Index, Node Tree, Node Number, Node Reference, Diagram Node Number." [IDEF0. Wikipedia]
The example "Design elements - IDEF0 diagram" is included in the IDEF0 Diagrams solution from the Software Development area of ConceptDraw Solution Park.
IDEF0 symbols
"Brand essence is a phrase that communicates the fundamental nature of a trade name associated with one or more products made by the same company. A business marketing team will often spend considerable time developing effective ways of expressing the brand essence of their company's various brands by highlighting the unique benefits provided that pertain to the values of its target subculture." [businessdictionary.com/ definition/ brand-essence.html]
Brand essence model diagram visually display key points of brand essence in easy to understand form.
The example of wheel diagram (ring diagram, bevel style circle diagram) "Brand essence model" was created using the ConceptDraw PRO diagramming and vector drawing software extended with the Target and Circular Diagrams solution from the Marketing area of ConceptDraw Solution Park.
www.conceptdraw.com/ solution-park/ marketing-target-and-circular-diagrams
Wheel diagram

- How to Diagram Sentences in ConceptDraw PRO | Sentence ...
- English Diagramming Sentences
- Sentence diagram - Compound predicate with one direct object ...
- The Reed-Kellogg system - Basic schemata | Sentence diagram ...
- Sentence Diagram | Examples of Reed-Kellogg diagrams | The ...
- Venn Diagram | Process Flowchart | Software Diagrams | Diagram ...
- Concept map template | Basic Diagramming | Simple Diagramming ...
- Concept map template | Value Stream Mapping | Basic ...
- Fundraising Pyramid | Examples of Reed-Kellogg diagrams | The ...
- Plumbing and Piping Plans | Examples of Reed-Kellogg diagrams ...
- Concept Maps | Mind Map Exchange | Basic Diagramming | Concept ...
- Design elements - IDEF0 diagram | Diagramming software for ...
- Computer and Networks Area | Office wireless network plan ...
- Entity-Relationship Diagram (ERD) with ConceptDraw PRO | UML ...
- Languages of South America - Thematic map | Bar Chart Software ...
- Design elements - Bulleted and numbered lists | How to Create a ...
- Workflow Process Example | Process Flowchart | Examples of Reed ...
- Concept map - Template | How To Make a Concept Map ...
- Design elements - List blocks | Design elements - Management list ...
- Horizontal bar chart - The most spoken languages of the world ...
- ERD | Entity Relationship Diagrams, ERD Software for Mac and Win
- Flowchart | Basic Flowchart Symbols and Meaning
- Flowchart | Flowchart Design - Symbols, Shapes, Stencils and Icons
- Flowchart | Flow Chart Symbols
- Electrical | Electrical Drawing - Wiring and Circuits Schematics
- Flowchart | Common Flowchart Symbols
- Flowchart | Common Flowchart Symbols