Venn Diagram

Types of Flowchart - Overview


Local area network (LAN). Computer and Network Examples
 diagram")
ConceptDraw - Perfect Network Diagramming Software with examples of LAN Diagrams. ConceptDraw Network Diagram is ideal for network engineers and network designers who need to draw Local Area Network diagrams.

Software Diagrams

ConceptDraw DIAGRAM is a perfect tool for Designing and planning tasks; Developing Visualization Solutions; Project Planning (Gantt Charts, Timelines, Project Schedules).
Pyramid Diagram

Software development with ConceptDraw DIAGRAM

ORM Diagram

Internet solutions with ConceptDraw DIAGRAM

Sequence Diagram Tool

Pyramid Diagram

Database Flowchart Symbols

ConceptDraw Software provides number of data-base chart libraries including major 49 vector symbols. Use these DFD flowchart symbol libraries to design data-base structure and models, use it to design data base process-oriented models, or simple data-oriented models. The are special drawing tools for making data flowcharts, data process diagrams, structured analysis diagrams, and information flow diagrams.
Pyramid Diagram

MS Visio Look a Like Diagrams

ConceptDraw DIAGRAM delivers full-functioned alternative to MS Visio. ConceptDraw DIAGRAM supports import of Visio files. ConceptDraw DIAGRAM supports flowcharting, swimlane, orgchart, project chart, mind map, decision tree, cause and effect, charts and graphs, and many other diagram types.
Making Diagrams Has Never Been Easier

Network Diagram Software Topology Network

Business diagrams & Org Charts with ConceptDraw DIAGRAM


How to Draw a Building Plans

Interactive Voice Response Network Diagram

Use ConceptDraw DIAGRAM diagramming and vector drawing software enhanced with solution Computer and Networks to visualize the logical and physical structure of IVR systems for inbound and outbound call centers and voice mail systems.
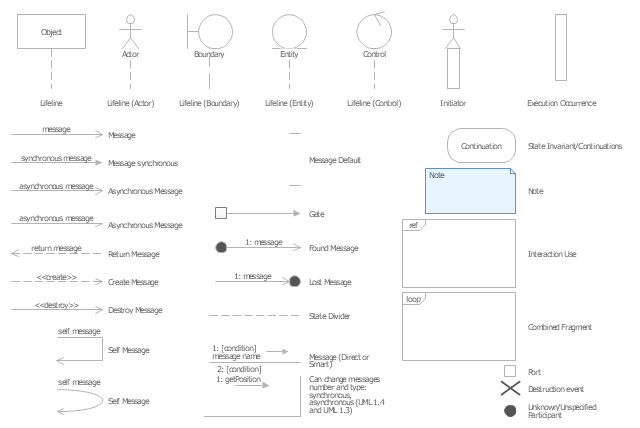
The vector stencils library "UML sequence diagrams" contains 50 symbols for the ConceptDraw PRO diagramming and vector drawing software.
"Sequence diagram ... building blocks.
If the lifeline is that of an object, it demonstrates a role. Note that leaving the instance name blank can represent anonymous and unnamed instances.
Messages, written with horizontal arrows with the message name written above them, display interaction. Solid arrow heads represent synchronous calls, open arrow heads represent asynchronous messages, and dashed lines represent reply messages. If a caller sends a synchronous message, it must wait until the message is done, such as invoking a subroutine. If a caller sends an asynchronous message, it can continue processing and doesn’t have to wait for a response. Asynchronous calls are present in multithreaded applications and in message-oriented middleware. Activation boxes, or method-call boxes, are opaque rectangles drawn on top of lifelines to represent that processes are being performed in response to the message (ExecutionSpecifications in UML).
Objects calling methods on themselves use messages and add new activation boxes on top of any others to indicate a further level of processing.
When an object is destroyed (removed from memory), an X is drawn on top of the lifeline, and the dashed line ceases to be drawn below it (this is not the case in the first example though). It should be the result of a message, either from the object itself, or another.
A message sent from outside the diagram can be represented by a message originating from a filled-in circle (found message in UML) or from a border of the sequence diagram (gate in UML)." [Sequence diagram. Wikipedia]
The example "Design elements - UML sequence diagrams" is included in the Rapid UML solution from the Software Development area of ConceptDraw Solution Park.
UML sequence diagram symbols
ERD Symbols and Meanings

The Chen's ERD notation is still used and is considered to present a more detailed way of representing entities and relationships.
To create an ERD, software engineers mainly turn to dedicated drawing software, which contain the full notation resources for their specific database design - ERD symbols and meanings. CS Odessa has released an all-inclusive Entity-Relationship Diagram (ERD) solution for their powerful drawing program, ConceptDraw DIAGRAM.

- Paragraph Writing From Flow Chart
- ATM Sequence diagram | UML activity diagram - Cash withdrawal ...
- Bank Sequence Diagram | ATM UML Diagrams | Bank ATM use ...
- Sequence Diagram How To Draw Asynchronous
- Design elements - Bank UML composite structure diagram | Design ...
- ConceptDraw Solution Park | ConceptDraw DIAGRAM Compatibility ...
- ATM Sequence diagram | Design elements - UML sequence ...
- Sales Process Flowchart Symbols | Flowchart design. Flowchart ...
- Bank Sequence Diagram | UML Sequence Diagram . Design ...
- UML sequence diagram
- Design elements - Sequence diagram | Design elements - UML ...
- How to Create a Bank ATM Use Case Diagram | UML use case ...
- Complete Use Case Diagram For Atm Withdrawal
- ATM UML Diagrams | How to Create a Bank ATM Use Case ...
- How to Convert ConceptDraw DIAGRAM v12 file into MS Visio 2003 ...
- Design elements - Bank UML sequence diagram | Design elements ...
- Vector stencils library - Sequence diagram | UML sequence diagram ...
- How to Create a Floor Plan for the Classroom | Classroom Seating ...
- Design elements - Bank UML sequence diagram | ATM UML ...
- Order processing center - UML sequence diagram | UML sequence ...
- ERD | Entity Relationship Diagrams, ERD Software for Mac and Win
- Flowchart | Basic Flowchart Symbols and Meaning
- Flowchart | Flowchart Design - Symbols, Shapes, Stencils and Icons
- Flowchart | Flow Chart Symbols
- Electrical | Electrical Drawing - Wiring and Circuits Schematics
- Flowchart | Common Flowchart Symbols
- Flowchart | Common Flowchart Symbols