This site uses cookies. By continuing to browse the ConceptDraw site you are agreeing to our Use of Site Cookies.

Stakeholder Onion Diagram Template

For depicting the onion model are actively used Stakeholder Onion Diagrams. The ConceptDraw DIAGRAM diagramming and vector drawing software extended with Stakeholder Onion Diagrams Solution from the Management Area of ConceptDraw Solution Park offers the number of useful tools and Stakeholder Onion Diagram template for their easy design.
HelpDesk

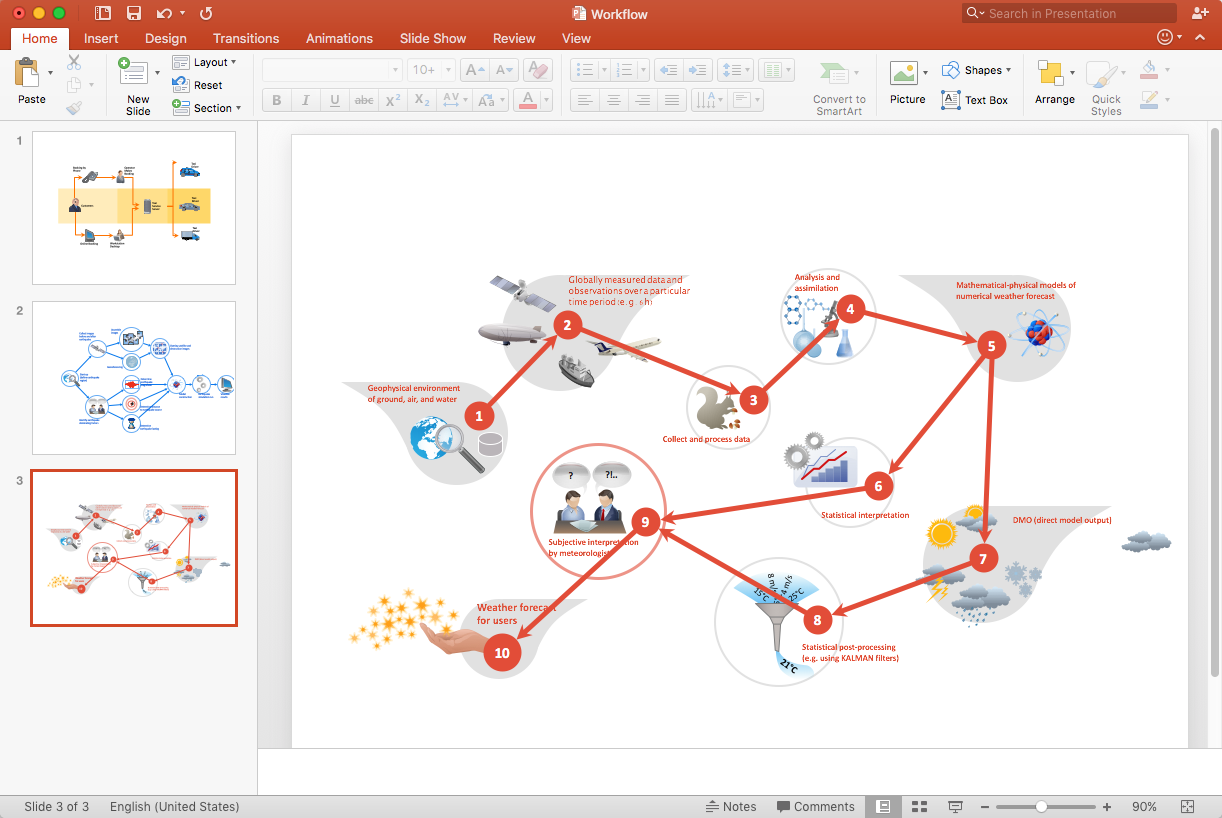
How to Add a Workflow Diagram to a PowerPoint Presentation

Making workflow diagrams in PowerPoint can help to describe the process within your organization as well as making comprehensive analysis presentations for sales or management and also can be used in other presentations and business documentation.
HelpDesk

How to Add a Bubble Diagram to PowerPoint Presentation

Bubble diagrams can be used to compare concepts and identify areas of similarity and difference. ConceptDraw DIAGRAM allows you to make an MS PowerPoint Presentation from your charts in a few simple steps. A bubble diagram is a chart that represents information visually in the form of a series of bubbles. Bubble charts are often used in marketing and management during the early stages of product development to visualize ideas and concepts by organizing them in a hierarchy. The ability to create this form of a diagram is contained within the Bubble Diagrams solution. A PowerPoint presentation of bubble diagrams can be used to demonstrate and identify areas of similarity and difference of featured business ideas and concepts.
HelpDesk

How to Add a Circle-spoke Diagram to PowerPoint

ConceptDraw DIAGRAM can be used as a tool for creating circle spoke diagrams along with other marketing diagrams. ConceptDraw DIAGRAM allows you to make an MS PowerPoint Presentation from your marketing diagrams in a few simple steps.
HelpDesk

How to Add a Block Diagram to a PowerPoint Presentation

Block diagram is a rather universal type of charts - compositions from geometric blocks can be applied to describe various kinds of processes or systems, consisting of components, which depend on each other. Block diagrams are indispensable when you need to represent a processor system on a basic level. With blocks, you can easily depict the basic elements of the process, without drilling down. The PowerPoint presentation of major process steps and key process participants can be very informative and helpful. Using ConceptDraw DIAGRAM, you can easily convert a block diagram to an MS PowerPoint presentation.
HelpDesk

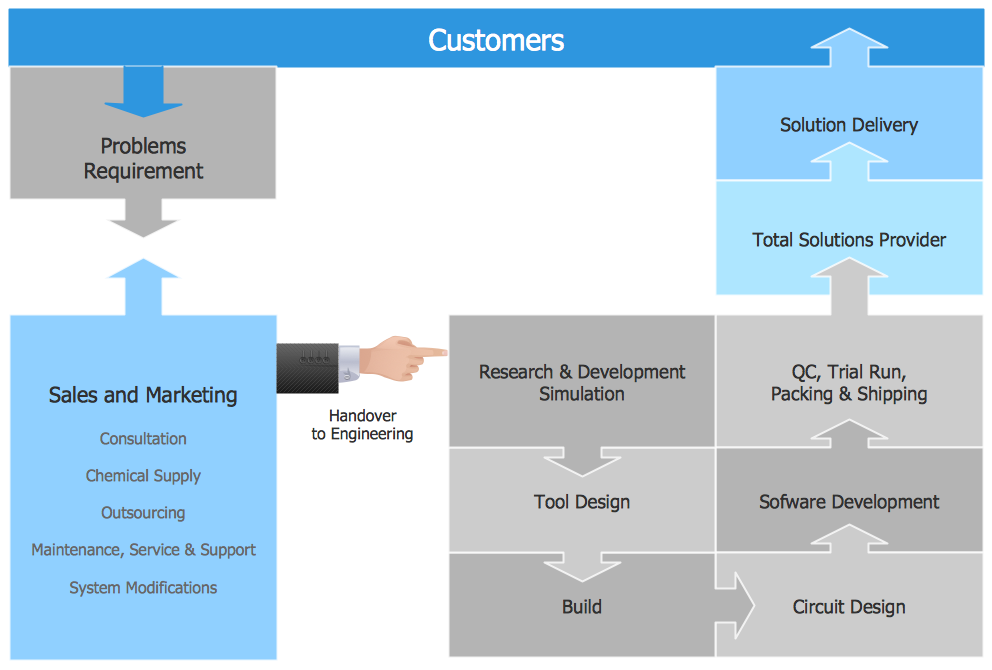
How To Present a Business Process Model

The most effective way of organizing and modeling a business process is to use a visual format. The visual approach to a business process modeling or analyzing enables each point to be displayed clearly and compendiously. To reach the professional norms necessary for business process diagrams, it's better to use ConceptDraw Business Process Mapping solution. It delivers an extensive choice of process mapping tools to help quality management and help improve business workflows. The export facilities of ConceptDraw DIAGRAM help make short work of presenting the business process model by export business process diagrams to MS PowerPoint.
HelpDesk

How to Add a Rack Diagram to a PowerPoint Presentation

Rack diagrams are created to make short work of configuring and documenting the server and network equipment of the rack frameworks. Rack diagrams may be useful when considering equipment purchasing or installing. Using the ConceptDraw Rack Diagrams solution, you can quickly and easily design a rack diagram from the set of vector graphics objects that are fully consistent with accepted industry standards. The Rack diagram will help you when considering and purchasing a rack of network equipment. When installing equipment, a rack diagram will help you to situate equipment quickly and in a due manner.
The PowerPoint presentation on the concept of your server room rack layouts can be very informative and helpful. ConceptDraw DIAGRAM allows you to easily create wireless network diagrams and then make a PowerPoint Presentation from your diagrams in a single click.
HelpDesk

How To Add a Computer Network Diagram to a PowerPoint Presentation

The PowerPoint presentation of the computer network can be very informative. ConceptDraw DIAGRAM allows you to easily create computer network diagrams and then make a PowerPoint Presentation from your network diagrams in a single click.
HelpDesk

How to Add a Telecommunication Network Diagram to a PowerPoint Presentation

Telecommunication network diagram represents a system consisting of computers, servers, telecommunication devices, switches, satellites, wireless transmitters, antennas, cables, etc., that link a set of remote nodes. It also describes a telephone exchange, that connects calls between landlines. ConceptDraw DIAGRAM allows you to easily create telecommunication network diagrams and then make a PowerPoint Presentation from your network documentation in a few clicks. Telecommunication network diagrams are used to show components and connections in a telecommunications network: how they are interacted between each other and with end-users. The PowerPoint presentation on the concept of telecom network can be very informative and helpful. ConceptDraw DIAGRAM allows you to make an MS PowerPoint Presentation from your telecommunication network diagrams in a few clicks.

Functional Flow Block Diagram

You need to draw a Functional Flow Block Diagram? You are an artist? Now it doesn't matter. With Block Diagrams solution from the "Diagrams" area for ConceptDraw Solution Park you don't need more to be an artist to design the Functional Flow Block Diagram of any complexity.

Organizational Chart Templates

ConceptDraw offers you a number of ready-made organizational chart templates which you can use in your drawing. They are grouped in topical sets as organizational chart template files.
Use the Organizational Charts Solution for ConceptDraw DIAGRAM to create your own Organizational Charts of any complexity quick, easy and effective.
The Organizational Charts designed with ConceptDraw DIAGRAM are vector graphic documents and are available for reviewing, modifying, converting to a variety of formats (image, HTML, PDF file, MS PowerPoint Presentation, Adobe Flash or MS Visio XML), printing and send via e-mail in one moment.
How to draw an Organizational Chart

fishbone diagram, Ishikawa diagram, cause and effect analysis Fishbone Diagram

fishbone diagram, Ishikawa diagram, cause and effect analysis
Fishbone Diagrams solution extends ConceptDraw DIAGRAM software with templates, samples and library of vector stencils for drawing the Ishikawa diagrams for cause and effect analysis.

Active Directory, network topology, Active Directory Domain Active Directory Diagrams

Active Directory, network topology, Active Directory Domain
Active Directory Diagrams solution significantly extends the capabilities of ConceptDraw DIAGRAM software with special Active Directory samples, convenient template and libraries of Active Directory vector stencils, common icons of sites and services, icons of LDPA elements, which were developed to help you in planning and modelling network structures and network topologies, in designing excellently looking Active Directory diagrams, Active Directory Structure diagrams, and Active Directory Services diagram, which are perfect way to visualize detailed structures of Microsoft Windows networks, Active Directory Domain topology, Active Directory Site topology, Organizational Units (OU), and Exchange Server organization.

Pyramid Diagram and Pyramid Chart

Pyramid Diagram is very useful to illustrate the foundation-based relationships. ConceptDraw DIAGRAM, a business charting software, includes some build-in symbols for designer to draw all kind of the pyramid diagrams.
HelpDesk

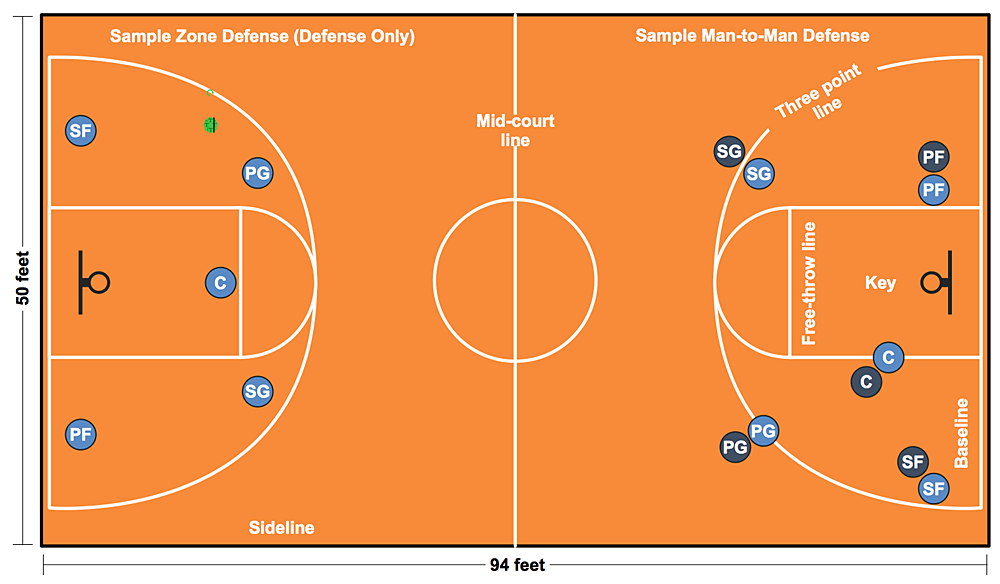
How to Make a Basketball Court Diagram

Basketball Court diagrams are often used as a teaching and learning tool for coaches, players and parents to describe the basketball moves and shooting drills. The ability to create Basketball diagrams with ConceptDraw DIAGRAM is contained in the Basketball solution. It provides a set of special tools for creating different Basketball diagrams. Basketball court diagram is used to describe basketball moves and shooting drills during the discussion of the match, as well as to develop a winning defense and attack strategy as a clear visual plan for future games.