Create TQM Flowcharts for Mac

Process Flowchart


 Total Quality Management TQM Diagrams
Total Quality Management Diagrams solution extends ConceptDraw PRO software with samples, templates and vector stencils library for drawing the TQM flowcharts.
TQM Diagram Example

TQM Software — Build Professional TQM Diagrams

"Classic TQM Tools ...
Flow Charts Pictures, symbols or text coupled with lines, arrows on lines show direction of flow. Flowcharting enables
modeling of processes; problems/ opportunities and decision points etc. It develops a common understanding of a process by those in
volved." [whaqualitycenter.org/ Portals/ 0/ Tools%20 to%20 Use/ Classic%20 Quality%20 Tools/ Classic%20 TQM%20 Tools%20 R%20 2-12.pdf]
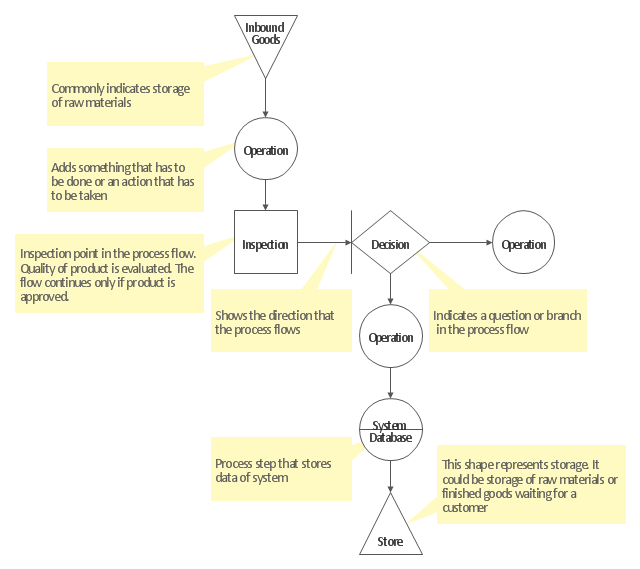
The vector stencils library TQM diagrams contains 58 symbols for drawing total quality management (TQM) flow charts using the ConceptDraw PRO diagramming and vector drawing software.
The example "Design elements - TQM diagram" is included in the Total Quality Management (TQM) Diagrams solution from the Quality area of ConceptDraw Solution Park.
Flow Charts Pictures, symbols or text coupled with lines, arrows on lines show direction of flow. Flowcharting enables
modeling of processes; problems/ opportunities and decision points etc. It develops a common understanding of a process by those in
volved." [whaqualitycenter.org/ Portals/ 0/ Tools%20 to%20 Use/ Classic%20 Quality%20 Tools/ Classic%20 TQM%20 Tools%20 R%20 2-12.pdf]
The vector stencils library TQM diagrams contains 58 symbols for drawing total quality management (TQM) flow charts using the ConceptDraw PRO diagramming and vector drawing software.
The example "Design elements - TQM diagram" is included in the Total Quality Management (TQM) Diagrams solution from the Quality area of ConceptDraw Solution Park.
TQM flow chart symbols

TQM Diagram — Professional Total Quality Management

HelpDesk
How to Create a TQM Diagram

Total Quality Management Definition

"The Process Flow Chart provides a visual representation of the steps in a process. ...
When to Use:
One of the first activities of a process improvement effort is constructing a flowchart. It provides the following benefits:
1- It give you and everyone a clear understanding of the process.
2- Facilitates teamwork and communication.
3- Helps to identify non-value-added operations."
[bexcellence.org/ Flow-Chart.html]
This TQM diagram example shows a business process that can be then analyzed to improve the effectiveness and diagnose quality issues that require resolution.
This example was created using the ConceptDraw PRO diagramming and vector drawing software extended with the Total Quality Management (TQM) Diagrams solution from the Quality area of ConceptDraw Solution Park.
TQM diagram

Business Diagram Software


Total Quality Management Density
 flowcharts")
"Classic TQM Tools ...
Flow Charts Pictures, symbols or text coupled with lines, arrows on lines show direction of flow. Flowcharting enables
modeling of processes; problems/ opportunities and decision points etc. It develops a common understanding of a process by those in
volved." [whaqualitycenter.org/ Portals/ 0/ Tools%20 to%20 Use/ Classic%20 Quality%20 Tools/ Classic%20 TQM%20 Tools%20 R%20 2-12.pdf]
The vector stencils library TQM diagrams contains 58 symbols for drawing total quality management (TQM) flow charts using the ConceptDraw PRO diagramming and vector drawing software.
The example "Design elements - TQM diagram" is included in the Total Quality Management (TQM) Diagrams solution from the Quality area of ConceptDraw Solution Park.
TQM flow chart symbols
HelpDesk
How to Create a Cross - Functional Flowchart Using ConceptDraw PRO


Probability Quality Control Tools

This TQM diagram example was redesigned from the illustration of the Highway Performance Monitoring System (HPMS) Field Manual from the website of the Federal Highway Administration (FHWA).
[fhwa.dot.gov/ policyinformation/ hpms/ fieldmanual/ chapter7.cfm]
"Highway Performance Monitoring System (HPMS).
The HPMS is a national level highway information system that includes data on the extent, condition, performance, use and operating characteristics of the nation's highways. The HPMS contains administrative and extent of system information on all public roads, while information on other characteristics is represented in HPMS as a mix of universe and sample data for arterial and collector functional systems. Limited information on travel and paved miles is included in summary form for the lowest functional systems.
HPMS was developed in 1978 as a continuing database, replacing the special biennial condition studies that had been conducted since 1965. The HPMS has been modified several times since its inception. Changes have been made to reflect changes in the highway systems, legislation, and national priorities, to reflect new technology, and to consolidate or streamline reporting requirements." [fhwa.dot.gov/ policyinformation/ hpms.cfm]
The TQM flowchart example "Software workflow diagram" was created using the ConceptDraw PRO diagramming and vector drawing software extended with the Total Quality Management (TQM) Diagrams solution from the Quality area of ConceptDraw Solution Park.
TQM diagram

The Fifty Two Elements of TQM

 ConceptDraw Solution Park
ConceptDraw Solution Park collects graphic extensions, examples and learning materials
"Flow Charts ...
Pictures, symbols or text coupled with lines, arrows on lines show direction of flow. Enables modelling of processes; problems/ opportunities and decision points etc. Develops a common understanding of a process by those involved. No particular standardisation of symbology, so communication to a different audience may require considerable time and explanation." [ifm.eng.cam.ac.uk/ research/ dstools/ tqm-tools/ ]
The TQM diagram template for the ConceptDraw PRO diagramming and vector drawing software is included in the Total Quality Management (TQM) Diagrams solution from the Quality area of ConceptDraw Solution Park.
TQM flowchart template
HelpDesk
How to Add a Cross-Functional Flowchart to a PowerPoint Presentation

- Tqm Flowchart Example
- Engineering | Process Flowchart | Total Quality Management TQM ...
- Tqm Chart
- TQM Software — Build Professional TQM Diagrams | Process ...
- Process Flowchart | Types of Flowchart - Overview | Total Quality ...
- Tqm Flowchart
- Process Flowchart | How to Manage Problem Solving Using Seven ...
- TQM Diagram Example | Process Flowchart | TQM Diagram ...
- Basic Flowchart Symbols and Meaning | Process Flowchart | Design ...
- Process Flowchart | Total Quality Management TQM Diagrams ...
- Process Flowchart | Design elements - TQM diagram | How to ...
- TQM Software — Build Professional TQM Diagrams | Probability ...
- Flowchart - HR management process | TQM Software — Build ...
- Cross Functional Flowchart Examples | Types of Flowchart ...
- Flow Chart Symbols
- Flowchart Software | Create TQM Flowcharts for Mac | Cross ...
- Process Flowchart | Cross-Functional Flowcharts | Total Quality ...
- Basic Flowchart Symbols and Meaning | Process Flowchart | Design ...
- TQM Diagram — Professional Total Quality Management | Business ...
- TQM Software — Build Professional TQM Diagrams | TQM Diagram ...
- ERD | Entity Relationship Diagrams, ERD Software for Mac and Win
- Flowchart | Basic Flowchart Symbols and Meaning
- Flowchart | Flowchart Design - Symbols, Shapes, Stencils and Icons
- Flowchart | Flow Chart Symbols
- Electrical | Electrical Drawing - Wiring and Circuits Schematics
- Flowchart | Common Flowchart Symbols
- Flowchart | Common Flowchart Symbols