Cloud Computing Architecture Diagrams

Taxi Service Data Flow Diagram DFD Example

"Dimensions of service quality.
A customer's expectation of a particular service is determined by factors such as recommendations, personal needs and past experiences. The expected service and the perceived service sometimes may not be equal, thus leaving a gap. The service quality model or the ‘GAP model’ developed by a group of authors- Parasuraman, Zeithaml and Berry at Texas and North Carolina in 1985 , highlights the main requirements for delivering high service quality. It identifies five ‘gaps’ that cause unsuccessful delivery. Customers generally have a tendency to compare the service they 'experience' with the service they 'expect' . If the experience does not match the expectation , there arises a gap. Ten determinants that may influence the appearance of a gap were described by Parasuraman, Zeithaml and Berry. in the SERVQUAL model: reliability, responsiveness, competence, access, courtesy, communication, credibility, security, understanding the customer and tangibles.
Later, the determinants were reduced to five: tangibles; reliability; responsiveness; service assurance and empathy in the so called RATER model." [Service quality. Wikipedia]
The block diagram example "Gap model of service quality" was created using the ConceptDraw PRO diagramming and vector drawing software extended with the Block Diagrams solution from the area "What is a Diagram" of ConceptDraw Solution Park.
Block diagram

UML Use Case Diagram Example - Taxi Service

This sample shows the work of the taxi service and is used by taxi stations, by airports, in the tourism field and delivery service.
How To create Diagrams for Amazon Web Services architecture

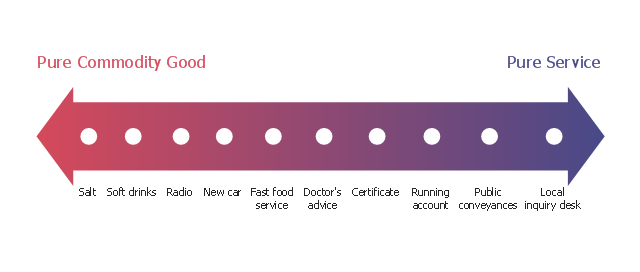
This marketing diagram sample depicts service-goods continuum.
"The dichotomy between physical goods and intangible services is an oversimplification; these are not discrete categories. Most business theorists see a continuum with pure service at one endpoint and pure commodity goods at the other endpoint. Most products fall between these two extremes. Goods are normally structural and can be transferred in an instant while services are delivered over a period of time. Goods can be returned while a service once delivered cannot. Goods are not always tangible and may be virtual." [Goods and services. Wikipedia]
The marketing chart example "Service-goods continuum diagram" was created using the ConceptDraw PRO diagramming and vector drawing software extended with the Marketing Diagrams solution from the Marketing area of ConceptDraw Solution Park.
Marketing chart
Diagramming tool - Amazon Web Services and Cloud Computing Diagrams

Diagramming software for Amazon Web Service diagrams, charts and schemes
Copying Service Process Flowchart. Flowchart Examples

This sample shows the Flowchart on that it is displayed the process of the determination the permissibility according the Access Copyright license. The diamonds represent the decision points. Inside the diamonds are the questions that need the answer yes/no. It is necessary to answer on the question, make the decision that will determine the next step.
"Causes in the diagram are often categorized, such as to ...
The 7 Ps (used in marketing industry):
(1) Product/ Service;
(2) Price;
(3) Place;
(4) Promotion;
(5) People/ personnel;
(6) Positioning;
(7) Packaging. " [Ishikawa diagram. Wikipedia]
This 8 Ps Ishikawa diagram (service cause and effect diagram) template is included in the Fishbone Diagram solution from the Management area of ConceptDraw Solution Park.
8Ps fishbone diagram

Active Directory Diagram

With the help of ConceptDraw DIAGRAM extended with Active Directory Diagrams Solution from the Computer and Networks Area you can easily and quickly create the highly detailed Active Directory Diagram.
How To Create a Workflow Diagram

The fastest way to create a workflow diagram is using pre-designed workflow template. ConceptDraw DIAGRAM with the Workflow Diagrams solution delivers rich set of workflow diagram templates you may start from.
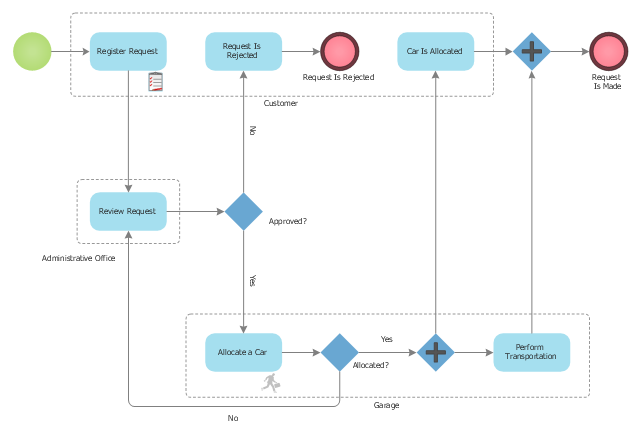
This BPMN (Business Process Model and Notation) diagram sample represents the taxi service order procedure workflow.
"A business process or business method is a collection of related, structured activities or tasks that produce a specific service or product (serve a particular goal) for a particular customer or customers. It often can be visualized with a flowchart as a sequence of activities with interleaving decision points or with a Process Matrix as a sequence of activities with relevance rules based on data in the process. ...
There are three types of business processes:
(1) Management processes, the processes that govern the operation of a system. Typical management processes include "corporate governance" and "strategic management".
(2) Operational processes, processes that constitute the core business and create the primary value stream. Typical operational processes are purchasing, manufacturing, advertising and marketing, and sales.
(3) Supporting processes, which support the core processes. Examples include accounting, recruitment, call center, technical support. ...
The ... improvement areas are equally applicable to policies, processes and detailed procedures (sub-processes/ tasks). There is a cascading effect of improvements made at a higher level on those made at a lower level.
For instance, if a recommendation to replace a given policy with a better one is made with proper justification and accepted in principle by business process owners, then corresponding changes in the consequent processes and procedures will follow naturally in order to enable implementation of the policies" [Business process. Wikipedia]
The business process modeling diagram example "Taxi service order procedure - BPMN 1.2 diagram" was created using the ConceptDraw PRO diagramming and vector drawing software extended with the Business Process Diagram solution from the Business Processes area of ConceptDraw Solution Park.
Business process modeling
 Telecommunication Network Diagrams
Telecommunication Network Diagrams solution extends ConceptDraw DIAGRAM software with samples, templates, and great collection of vector stencils to help the specialists in a field of networks and telecommunications, as well as other users to create Computer systems networking and Telecommunication network diagrams for various fields, to organize the work of call centers, to design the GPRS networks and GPS navigational systems, mobile, satellite and hybrid communication networks, to construct the mobile TV networks and wireless broadband networks.
Diagramming software for Amazon Web Service icon set: Networking and Content Delivery
Diagramming software for Amazon Web Service icon set: Storage
"Causes in the diagram are often categorized, such as to ...
The 5 Ss (used in service industry):
(1) Samples;
(2) Scheme;
(3) Synchronous;
(4) Skin;
(5) Search." [Ishikawa diagram. Wikipedia]
This service 4 Ss Ishikawa diagram (cause and effect diagram) template is included in the Fishbone Diagram solution from the Management area of ConceptDraw Solution Park.
4Ss fishbone diagram

HelpDesk
How to Create an AWS Architecture Diagram

AWS Simple Icons for Architecture Diagrams

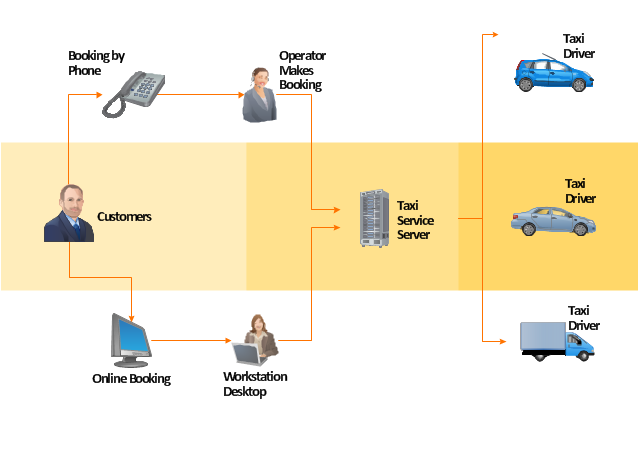
"A taxicab, also known as a taxi or a cab, is a type of vehicle for hire with a driver, used by a single passenger or small group of passengers often for a non-shared ride. A taxicab conveys passengers between locations of their choice. In modes of public transport, the pick-up and drop-off locations are determined by the service provider, not by the passenger, although demand responsive transport and share taxis provide a hybrid bus/ taxi mode.
There are four distinct forms of taxicab, which can be identified by slightly differing terms in different countries:
(1) Hackney carriages also known as public hire, hailed or street taxis, licensed for hailing throughout communities.
(2) Private hire vehicles, also known as minicabs or private hire taxis, licensed for pre-booking only.
(3) Taxibuses, also known as Jitneys, operating on pre-set routes typified by multiple stops and multiple independent passengers.
(4) Limousines, specialized vehicle licensed for operation by pre-booking.
Although types of vehicles and methods of regulation, hiring, dispatching, and negotiating payment differ significantly from country to country, many common characteristics exist." [Taxicab. Wikipedia]
The example "Workflow diagram - Taxi service" was drawn using the ConceptDraw PRO diagramming and vector drawing software extended with the Workflow Diagrams solution from the Business Processes area of ConceptDraw Solution Park.
Work flow chart
- Fishbone Diagrams | How Do Fishbone Diagrams Solve ...
- Process Flowchart | Taxi Service Data Flow Diagram DFD Example ...
- Taxi service - Workflow diagram | Workflow Process Example | Taxi ...
- Fishbone Diagrams | Service 4 Ss fishbone diagram - Template ...
- Fishbone Diagrams | Fishbone Diagram | Service 4 Ss fishbone ...
- The Fish Bone Diagram In Service Marketing
- Bank Sequence Diagram | UML use case diagram - Banking system ...
- Service Provider Like Electrician Plumber Er Diagram
- Process Flowchart | UML Use Case Diagram Example Registration ...
- Fishbone Diagrams | Draw Fishbone Diagram on MAC Software ...
- Service -goods continuum diagram | Goods Service Continuum ...
- Block diagram - Gap model of service quality | Service 4 Ss fishbone ...
- Service Delivery Process Flow Chart
- Service -goods continuum diagram | Explain Goods Service ...
- Active Directory Domain Services
- Service -goods continuum diagram | AWS Architecture Diagrams ...
- Providing telecom services - Cross-functional flowchart | Cross ...
- Service 8 Ps fishbone diagram - Template | Fishbone Diagrams ...
- Taxi Service Data Flow Diagram DFD Example | Types of Flowchart ...
- Draw A Diagram That Illustrates The Chain Of Customer Service
- ERD | Entity Relationship Diagrams, ERD Software for Mac and Win
- Flowchart | Basic Flowchart Symbols and Meaning
- Flowchart | Flowchart Design - Symbols, Shapes, Stencils and Icons
- Flowchart | Flow Chart Symbols
- Electrical | Electrical Drawing - Wiring and Circuits Schematics
- Flowchart | Common Flowchart Symbols
- Flowchart | Common Flowchart Symbols