Venn Diagram

Basic Flowchart Symbols and Meaning


Process Flowchart


Pyramid Diagram

How to Make SWOT Analysis in a Word Document

ConceptDraw products across any platform, meaning you never have to worry about compatibility again. ConceptDraw MINDMAP allows you to make SWOT analysis on PC or macOS operating systems.
Pie Chart Word Template. Pie Chart Examples

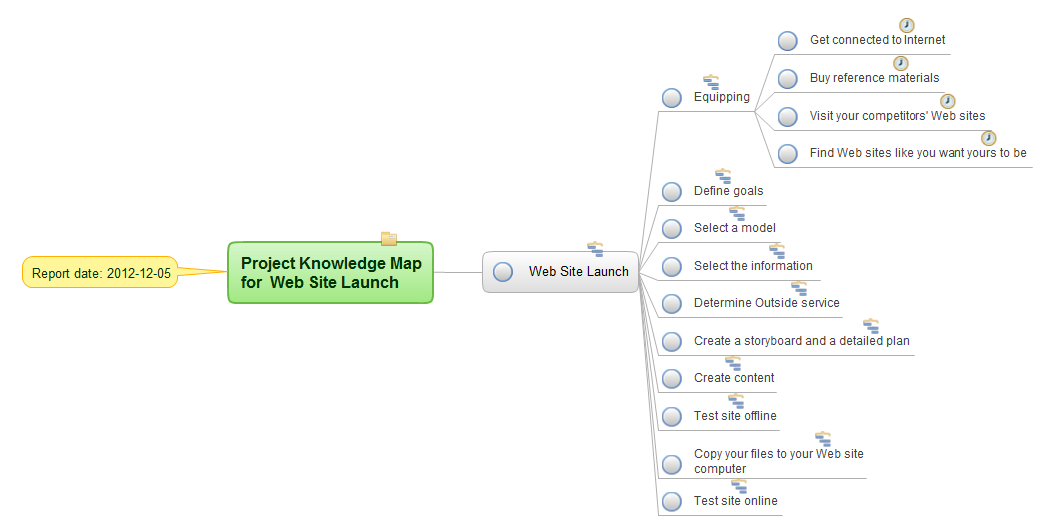
How To Use Collaboration Tool in Project Management

Pyramid Diagram

Risk Diagram (Process Decision Program Chart)

The PDPC determines the risks when corrective action is not performed correctly. Also, it helps develop descriptions for preventive actions at the level of execution.
Pyramid Diagram

 Venn Diagrams
Venn Diagrams are actively used to illustrate simple set relationships in set theory and probability theory, logic and statistics, mathematics and computer science, linguistics, sociology, and marketing. Venn Diagrams are also often used to visually summarize the status and future viability of a project.
Communication Tool for Remote Project Management

Remote Presentation for Skype solution for ConceptDraw MINDMAP helps communicate with remote team and customers in visual manner on wide range of issues. Using this solution for regular status meetings allows you to push your team on tasks and keep task statuses up to date.
Concept Map

How to draw a Concept Map quick, easy and effective? ConceptDraw DIAGRAM offers the unique Concept Maps Solution from the "Diagrams" Area that will help you!
Venn Diagram Maker

- Venn Diagram Template for Word | Venn Diagrams | Venn Diagram ...
- How To Draw A Cycle Diagram In Word
- 3 Circle Venn Diagram . Venn Diagram Example | Multi Layer Venn ...
- Download Dfd Word File
- Venn Diagram
- Block Diagram | Telecommunication Network Diagrams | Cisco ...
- Venn Diagram Template for Word | SWOT Matrix Template | Onion ...
- Venn Diagram Template for Word | Venn Diagram | Total Quality ...
- 4 Level pyramid model diagram - Information systems types ...
- Concept Maps | Concept Mapping | How To Make a Concept Map ...
- Basic CCTV System Diagram . CCTV Network Diagram Example ...
- Free Sipoc Diagram Template For Word Powerpoint Pdf
- MS Word Function Flowchart
- Pie Chart Word Template. Pie Chart Examples | Pyramid Diagram ...
- Pyramid Diagram
- Venn Diagram Examples for Problem Solving. Venn Diagram as a ...
- Biology Drawing Software | How to Draw Biology Diagram in ...
- Product life cycle process - Flowchart | Project management life ...
- Concept Map Venn Diagram
- Circular Flow Diagram Template
- ERD | Entity Relationship Diagrams, ERD Software for Mac and Win
- Flowchart | Basic Flowchart Symbols and Meaning
- Flowchart | Flowchart Design - Symbols, Shapes, Stencils and Icons
- Flowchart | Flow Chart Symbols
- Electrical | Electrical Drawing - Wiring and Circuits Schematics
- Flowchart | Common Flowchart Symbols
- Flowchart | Common Flowchart Symbols