UML Class Diagram Example for Transport System

This sample shows the transport protocol mappings for SNMP (Simple Network Management Protocol), the classes of the transport system and relationships between them and is used in IP network.
UML Class Diagram Example for GoodsTransportation System

This sample shows the concept of working of the transport company and is used by transport companies, carriers at the transportation of various goods.
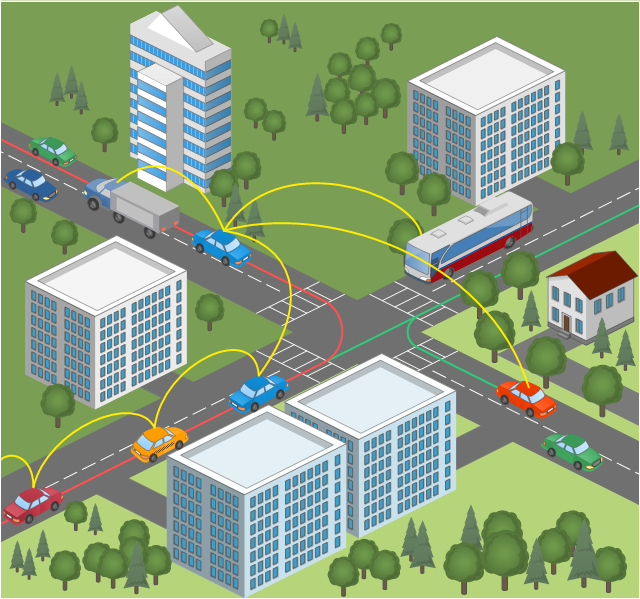
This vehicular network diagram sample was drawn on the base of picture illustrating the post "Intelligent transportation system" from the blog "Technology New Here".
"Intelligent transportation systems are projects that aim to integrate modern communication and information technology into existing transportation management systems in order to optimize vehicle life, fuel efficiency, safety, and traffic in urbanized cities.
The need for intelligent transportation systems stems from the fact that traffic congestion has been increasing all around the world because of increasing population, increasing amount of transportation vehicles and increasing urbanization."
[technologynewhere.wordpress.com/ 2010/ 05/ 12/ intelligent-transportation-system/ ]
The vehicular network diagram example "Intelligent transportation system" was created using the ConceptDraw PRO diagramming and vector drawing software extended with the Vehicular Networking solution from the Computer and Networks area of ConceptDraw Solution Park.
Vehicular network diagram
Rail transport - Design elements

Use it to draw illustrations of trains and transportation of passengers and goods by railroads.
Transportation Infographics

"The Process Flow Chart provides a visual representation of the steps in a process. ...
When to Use:
One of the first activities of a process improvement effort is constructing a flowchart. It provides the following benefits:
1- It give you and everyone a clear understanding of the process.
2- Facilitates teamwork and communication.
3- Helps to identify non-value-added operations."
[bexcellence.org/ Flow-Chart.html]
This TQM diagram example shows a business process that can be then analyzed to improve the effectiveness and diagnose quality issues that require resolution.
This example was created using the ConceptDraw PRO diagramming and vector drawing software extended with the Total Quality Management (TQM) Diagrams solution from the Quality area of ConceptDraw Solution Park.
TQM diagram

This TQM diagram example was redesigned from the illustration of the Highway Performance Monitoring System (HPMS) Field Manual from the website of the Federal Highway Administration (FHWA).
[fhwa.dot.gov/ policyinformation/ hpms/ fieldmanual/ chapter7.cfm]
"Highway Performance Monitoring System (HPMS).
The HPMS is a national level highway information system that includes data on the extent, condition, performance, use and operating characteristics of the nation's highways. The HPMS contains administrative and extent of system information on all public roads, while information on other characteristics is represented in HPMS as a mix of universe and sample data for arterial and collector functional systems. Limited information on travel and paved miles is included in summary form for the lowest functional systems.
HPMS was developed in 1978 as a continuing database, replacing the special biennial condition studies that had been conducted since 1965. The HPMS has been modified several times since its inception. Changes have been made to reflect changes in the highway systems, legislation, and national priorities, to reflect new technology, and to consolidate or streamline reporting requirements." [fhwa.dot.gov/ policyinformation/ hpms.cfm]
The TQM flowchart example "Software workflow diagram" was created using the ConceptDraw PRO diagramming and vector drawing software extended with the Total Quality Management (TQM) Diagrams solution from the Quality area of ConceptDraw Solution Park.
TQM diagram

Brilliant Examples of Infographics Map, Transport, Road

 Fishbone Diagrams
The Fishbone Diagrams solution extends ConceptDraw PRO v10 software with the ability to easily draw the Fishbone Diagrams (Ishikawa Diagrams) to clearly see the cause and effect analysis and also problem solving. The vector graphic diagrams produced using this solution can be used in whitepapers, presentations, datasheets, posters, and published technical material.
Spatial infographics Design Elements: Transport Map

Road Transport - Design Elements

 Transport Hazard Pictograms
Transport Hazard Pictograms solution includes large variety of specially developed samples with transport hazard symbols and pictograms, and the whole set of predesigned vector transport GHS pictograms download and used with ease from the Transport Hazard Pictograms library. Apply them for quick designing professional-looking infographics and diagrams, use them to create warning signboards and announcements on all stages of the transportation process, to place them on the transport vehicles and warehouses of transportation companies, at the transport documentation and on the websites of transport and logistics companies.
UML Class Diagram Example - Apartment Plan

This sample show the detailed plan of the apartment and is used by building companies, design apartments, real estate agencies, at the buying / selling of the realty.
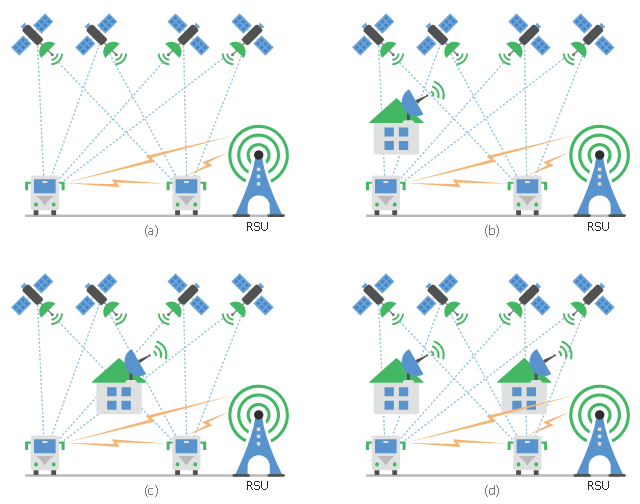
This diagram sample shows the different situations that cooperative positioning may be helpful for vehicular networks. It was designed on the base of Wikimedia Commons file: CPsituations.jpg.
[commons.wikimedia.org/ wiki/ File:CPsituations.jpg]
"Vehicular Ad Hoc Networks (VANETs) are created by applying the principles of mobile ad hoc networks (MANETs) - the spontaneous creation of a wireless network for data exchange - to the domain of vehicles. They are a key component of intelligent transportation systems (ITS).
While, in the early 2000s, VANETs were seen as a mere one-to-one application of MANET principles, they have since then developed into a field of research in their own right. By 2015, the term VANET became mostly synonymous with the more generic term inter-vehicle communication (IVC), although the focus remains on the aspect of spontaneous networking, much less on the use of infrastructure like Road Side Units (RSUs) or cellular networks." [Vehicular ad hoc network. Wikipedia]
The vehicular network diagram example "CP situations" was created using the ConceptDraw PRO diagramming and vector drawing software extended with the Computers and Communications solution from the Illustration area of ConceptDraw Solution Park.
Telecommunication diagram
- UML Class Diagram Example for Transport System
- Example Of Use Case Diagram In Transportation System
- Use Case Diagram For Transportation Management System
- Ishikawa Diagram Transport
- Class Diagram Of Transportation Management System
- Transport Management System Data Flow Diagram
- UML Class Diagram Example for Transport System
- How Can We Draw Of Deployment Diagram For Transport System
- Draw A Diagram Of Various Means Of Transportation
- Transport Management System Project Er Diagram
- Class Diagram Of Transport Magement System Project In Pdf
- What Is Tree Diagram Of Transport
- Sample Transport Network Map Diagram
- Transport Management System For Usecase Diagram
- Data Flow Diagram For Transport Management Systems
- Transportation Infographics | Intelligent transportation system | UML ...
- Transport System Erd
- UML Class Diagram Example for Transport System | Brilliant ...
- How Does The Diagram Of An Illustration Of Transportation Look Like
- Intelligent transportation system | Star Network Topology | Software ...
- ERD | Entity Relationship Diagrams, ERD Software for Mac and Win
- Flowchart | Basic Flowchart Symbols and Meaning
- Flowchart | Flowchart Design - Symbols, Shapes, Stencils and Icons
- Flowchart | Flow Chart Symbols
- Electrical | Electrical Drawing - Wiring and Circuits Schematics
- Flowchart | Common Flowchart Symbols
- Flowchart | Common Flowchart Symbols