How to Report Task's Execution with Gantt Chart

How To Create Project Report

HelpDesk
How to Publish Project Reports on the Web

This interactive voice response (IVR) flowchart sample shows the store reporting process flow.
"Call centers use IVR systems to identify and segment callers. The ability to identify customers allows services to be tailored according to the customer profile. The caller can be given the option to wait in the queue, choose an automated service, or request a callback. The system may obtain caller line identification (CLI) data from the network to help identify or authenticate the caller. Additional caller authentication data could include account number, personal information, password and biometrics (such as voice print).
When an IVR system answers multiple phone numbers the use of DNIS ensures that the correct application and language is executed. A single large IVR system can handle calls for thousands of applications, each with its own phone numbers and script.
IVR also enables customer prioritization. In a system wherein individual customers may have a different status the service will automatically prioritize the individual's call and move customers to the front of a specific queue. Prioritization could also be based on the DNIS and call reason." [Interactive voice response. Wikipedia]
The IVR diagram example "Store reporting flowchart" was created using the ConceptDraw PRO diagramming and vector drawing software extended with the Interactive Voice Response Diagrams solution from the Computer and Networks area of ConceptDraw Solution Park.
IVR diagram

This interactive voice response (IVR) diagram sample shows how Voice over Internet Protocol (VoIP) works. It was designed on the base of the Wikimedia Commons file: Voip HowItWorks 0203v2.jpg. [commons.wikimedia.org/ wiki/ File:Voip_ HowItWorks_ 0203v2.jpg]
"Voice over Internet Protocol (Voice over IP, VoIP) is a methodology and group of technologies for the delivery of voice communications and multimedia sessions over Internet Protocol (IP) networks, such as the Internet. Other terms commonly associated with VoIP are IP telephony, Internet telephony, broadband telephony, and broadband phone service." [Voice over IP. Wikipedia]
The IVR diagram example "How VoIP works" was designed using ConceptDraw PRO diagramming and vector drawing software extended with the Interactive Voice Response Diagrams solution from the Computer and Networks area of ConceptDraw Solution Park.
IVR diagram

Business Report Pie. Pie Chart Examples

Cause and Effect Analysis - Fishbone Diagrams for Problem Solving

Process Flowchart


Communication Tool for Remote Project Management

Remote Presentation for Skype solution for ConceptDraw MINDMAP helps communicate with remote team and customers in visual manner on wide range of issues. Using this solution for regular status meetings allows you to push your team on tasks and keep task statuses up to date.
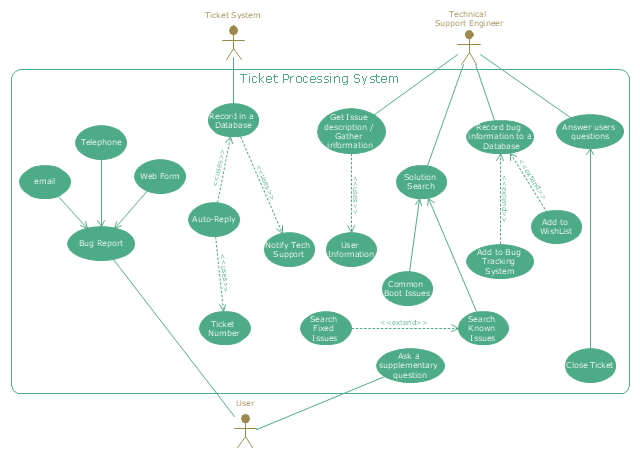
"An example scenario is presented to demonstrate how a common issue tracking system would work:
(1) A customer service technician receives a telephone call, email, or other communication from a customer about a problem. Some applications provide built-in messaging system and automatic error reporting from exception handling blocks.
(2) The technician verifies that the problem is real, and not just perceived. The technician will also ensure that enough information about the problem is obtained from the customer. This information generally includes the environment of the customer, when and how the issue occurs, and all other relevant circumstances.
(3) The technician creates the issue in the system, entering all relevant data, as provided by the customer.
(4) As work is done on that issue, the system is updated with new data by the technician. Any attempt at fixing the problem should be noted in the issue system. Ticket status most likely will be changed from open to pending.
(5) After the issue has been fully addressed, it is marked as resolved in the issue tracking system.
If the problem is not fully resolved, the ticket will be reopened once the technician receives new information from the customer. A Run Book Automation process that implements best practices for these workflows and increases IT personnel effectiveness is becoming very common." [Issue tracking system. Wikipedia]
The UML use case diagram example "Ticket processing system" was created using the ConceptDraw PRO diagramming and vector drawing software extended with the Rapid UML solution from the Software Development area of ConceptDraw Solution Park.
UML use case diagram
Examples of Flowcharts, Org Charts and More


How To Hold Project Collaboration via Skype


UML Deployment Diagram Example - ATM System UML diagrams

This sample shows the work of the ATM (Automated Teller Machine) banking system that is used for service and performing of the banking transactions using ATMs. System engineers can use comprehensive UML diagrams solution.
Swim Lane Diagrams

CORRECTIVE ACTIONS PLANNING. Risk Diagram (PDPC)
 - Health care")

- Store reporting flowchart | How to Create an Interactive Voice ...
- Store reporting flowchart | Interactive Voice Response Diagrams ...
- Interactive Voice Response Diagrams | IVR Network Diagram | Store ...
- Interactive Voice Response Diagrams | Store reporting flowchart ...
- Design elements - IVR blocks | Store reporting flowchart | How to ...
- Reporting Flow Chart Template
- Reporting System Of Library Management System Dfd Diagram
- Store reporting flowchart | IVR Network Diagram | Interactive Voice ...
- Process Flowchart | Program Structure Diagram | How to Report ...
- Interactive Voice Response Diagrams | IVR flowchart - Store ...
- Store reporting flowchart | Interactive Voice Response Diagrams ...
- IVR flowchart - Store reporting | How to Create an Interactive Voice ...
- Er Diagram Of Atm Reporting System Project
- IVR Network Diagram | IVR | Store reporting flowchart | Interact Call ...
- Weather Report With Diagram
- Types of Flowchart - Overview | Pyramid Diagram | How to Report ...
- How to Create an Interactive Voice Response (IVR) Diagram in ...
- IVR services | IVR balance recharge | Store reporting flowchart | Ivr ...
- Database Design | Store reporting flowchart | How to Create an ...
- How to Report Task's Execution with Gantt Chart | 5-Set Venn ...
- ERD | Entity Relationship Diagrams, ERD Software for Mac and Win
- Flowchart | Basic Flowchart Symbols and Meaning
- Flowchart | Flowchart Design - Symbols, Shapes, Stencils and Icons
- Flowchart | Flow Chart Symbols
- Electrical | Electrical Drawing - Wiring and Circuits Schematics
- Flowchart | Common Flowchart Symbols
- Flowchart | Common Flowchart Symbols