HelpDesk
How to Create Project Diagrams on Mac

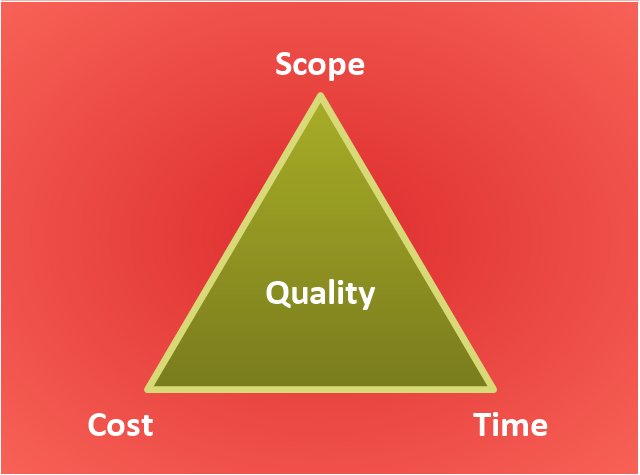
"The Project Management Triangle (called also Triple Constraint or the Iron Triangle) is a model of the constraints of project management. It is a graphic aid where the three attributes show on the corners of the triangle to show opposition. It is useful to help with intentionally choosing project biases, or analyzing the goals of a project. It is used to illustrate that project management success is measured by the project team's ability to manage the project, so that the expected results are produced while managing time and cost." [Project management triangle. Wikipedia]
The pyramid chart example "Project management triangle diagram" was redesigned using the ConceptDraw PRO diagramming and vector drawing software from Wikimedia Commons file Project-triangle-en.svg. [commons.wikimedia.org/ wiki/ File:Project-triangle-en.svg]
The project management triangle chart example is included in the Pyramid Diagrams solution from the Marketing area of ConceptDraw Solution Park.
Pyramid diagram
 PM Response
The PM Response solution extends the functional abilities in project management for all three ConceptDraw products by helping to improve the response time to project changes, to plan on how to effectively respond on issues and events impacting the project. It supplies the project managers, team leaders, and all other project participants with wide abilities of iteration planning, creative collaboration, effective decision-making, discussions of the project layout approaches and solving the project challenges, lets them use mind mapping technique for iteration planning and applying the project changes, to represent the projects data as Mind Maps and use them to construct the clear plans, to convert project maps to project implementations, to use different kinds of Visual diagrams to solve the current project problems and to make correct decisions, to plan resources usage and to respond to changes in the project environment.
Project —Task Trees and Dependencies

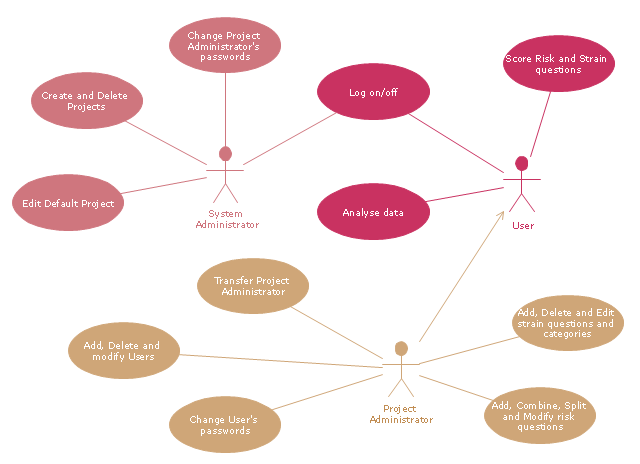
"A project manager is the person responsible for accomplishing the stated project objectives. Key project management responsibilities include creating clear and attainable project objectives, building the project requirements, and managing the constraints of the project management triangle, which are cost, time, scope, and quality.
A project manager is often a client representative and has to determine and implement the exact needs of the client, based on knowledge of the firm they are representing. A project manager is the bridging gap between the production team and client. So he/ she must have a fair knowledge of the industry they are in so that they are capable of understanding and discussing the problems with either party. The ability to adapt to the various internal procedures of the contracting party, and to form close links with the nominated representatives, is essential in ensuring that the key issues of cost, time, quality and above all, client satisfaction, can be realized.
The term and title 'project manager' has come to be used generically to describe anyone given responsibility to complete a project. However, it is more properly used to describe a person with full responsibility and the same level of authority required to complete a project. If a person does not have high levels of both responsibility and authority then they are better described as a project administrator, coordinator, facilitator or expeditor." [Project manager. Wikipedia]
The UML use case diagram example "Project administrator" was created using the ConceptDraw PRO diagramming and vector drawing software extended with the Rapid UML solution from the Software Development area of ConceptDraw Solution Park.
UML use case diagram
 PM Dashboards
The PM Dashboards solution extends the management boundaries of ConceptDraw DIAGRAM and ConceptDraw PROJECT products with an ability to demonstrate changes to the budget status, to show the project progress toward its objectives, to display clearly the identified key performance indicator (KPI) or the set of key performance indicators for any project. This solution provides you with examples and ability to generate three types of visual dashboards reports based on your project data Project Dashboard, Tactical Dashboard, and Radar Chart. By dynamically charting the project’s key performance indicators that are collected on one ConceptDraw DIAGRAM document page, all project participants, project managers, team members, team leaders, stakeholders, and the entire organizations, for which this solution is intended, have access to the daily status of projects they are involved in.
 PM Presentations
The PM Presentations solution extends the power of ConceptDraw MINDMAP , ConceptDraw DIAGRAM , and ConceptDraw PROJECT, improving their efficiency at many stages of the project management process by using the same source data to construct the targeted presentation for your audience and clearly communicating the appropriate information to different audiences from a single source. It gives an ability to project managers and other team participants to create and to deliver capacious presentations representing the data and knowledge of a specific project with the help of including visual dashboards, Gantt charts, resource views, maps, timelines, calendars, illustrations, project diagrams and reports of varied types. Having the possibility to edit collaboratively in a Full-Screen Mode, the teams can rapidly plan a project as well as execute the tasks of revising and making changes to it.
HelpDesk
How to Create a Timeline Diagram

- Activities In A Project Management Software With Example Diagram
- Diagram Of It Project Management
- Software Work Flow Process in Project Management with Diagram ...
- Project Management Structure Diagram
- Project Management Diagram
- ConceptDraw PROJECT Project Management Tool | Bar Diagrams ...
- Activity Diagram For Project Management System
- Conceptdraw.com: Mind Map Software, Drawing Tools | Project ...
- Project Management Diagrams
- Process Flowchart | Project management life cycle - Flowchart ...
- Project planning diagram | Project planning process - Flowchart ...
- Project —Task Trees and Dependencies | UML Diagram Types List ...
- What Is Er Diagram Sample Project Management System
- Diagram For Business Strategy Project Management
- Pyramid Diagram | Software Work Flow Process in Project ...
- Milestone Project Management Example
- Project management life cycle - Flowchart | Basic Diagramming ...
- Circular Arrows Diagrams | Create Response Charts | Gant Chart in ...
- Marketing Diagrams | Gant Chart in Project Management | Pyramid ...
- Activity Network Diagram Method | Gant Chart in Project ...
- ERD | Entity Relationship Diagrams, ERD Software for Mac and Win
- Flowchart | Basic Flowchart Symbols and Meaning
- Flowchart | Flowchart Design - Symbols, Shapes, Stencils and Icons
- Flowchart | Flow Chart Symbols
- Electrical | Electrical Drawing - Wiring and Circuits Schematics
- Flowchart | Common Flowchart Symbols
- Flowchart | Common Flowchart Symbols