Process Flowchart


"Causes in the diagram are often categorized, such as to the 6 M's ...
The 6 Ms (used in manufacturing industry):
(1) Machine (technology);
(2) Method (process);
(3) Material (Includes Raw Material, Consumables and Information.);
(4) Man Power (physical work)/ Mind Power (brain work): Kaizens, Suggestions;
(5) Measurement (Inspection);
(6) Milieu/ Mother Nature (Environment).
The original 6Ms used by the Toyota Production System have been expanded by some to include the following and are referred to as the 8Ms. However, this is not globally recognized. It has been suggested to return to the roots of the tools and to keep the teaching simple while recognizing the original intent; most programs do not address the 8Ms.
(7) Management/ Money Power;
(8) Maintenance." [Ishikawa diagram. Wikipedia]
This 8Ms Ishikawa diagram (manufacturing cause and effect diagram) template is included in the Fishbone Diagram solution from the Management area of ConceptDraw Solution Park.
8Ms Ishikawa diagram

Data Flow Diagram Model

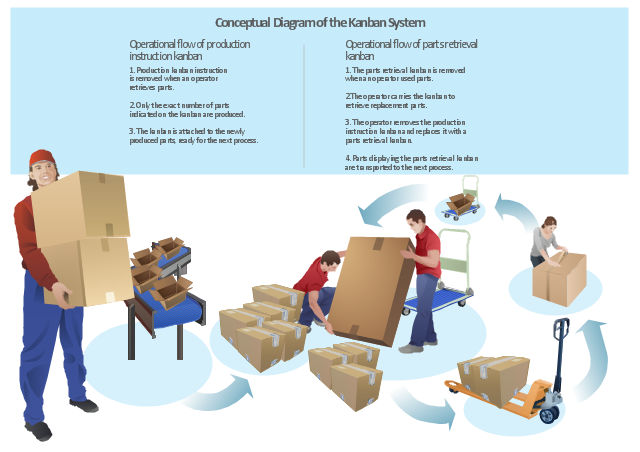
"Kanban ... (literally signboard or billboard) is a scheduling system for lean and just-in-time (JIT) production. Kanban is a system to control the logistical chain from a production point of view, and is not an inventory control system. Kanban was developed by Taiichi Ohno, at Toyota, to find a system to improve and maintain a high level of production. Kanban is one method through which JIT is achieved.
Kanban became an effective tool in support of running a production system as a whole, and it proved to be an excellent way for promoting improvement. Problem areas were highlighted by reducing the number of kanban in circulation." [Kanban. Wikipedia]
The example "Conceptual diagram of the Kanban System" was created in the ConceptDraw PRO diagramming and vector drawing software using the vector stencils library Packaging, loading, customs.
The example "Conceptual diagram of the Kanban System" is included in the Manufacturing and Maintenance solution from the Illustration area of ConceptDraw Solution Park.
Infographics
Swim Lane Diagrams

This circular arrows diagram sample depicts the Plan–Do–Check–Act cycle.
"PDCA (plan–do–check–act or plan–do–check–adjust) is an iterative four-step management method used in business for the control and continuous improvement of processes and products. It is also known as the Deming circle/ cycle/ wheel, Shewhart cycle, control circle/ cycle, or plan–do–study–act (PDSA). Another version of this PDCA cycle is OPDCA. The added "O" stands for observation or as some versions say "Grasp the current condition." This emphasis on observation and current condition has currency with Lean manufacturing/ Toyota Production System literature." [PDCA. Wikipedia]
The diagram example "PDCA cycle" was created using the ConceptDraw PRO diagramming and vector drawing software extended with the Circular Arrows Diagrams solution from the area "What is a Diagram" of ConceptDraw Solution Park.
Circular arrows diagram

Gane Sarson Diagram

Total Quality Management Value

Work Flow Process Chart

IDEF0 Diagram

IDEF9 Standard

Data Flow Diagram Examples

Types of Flowcharts


Value stream with ConceptDraw PRO

UML Use Case Diagram Example Registration System

This sample shows the types of user’s interactions with the system and is used at the registration and working with the database system.
- Production System Model Flow Diagram
- Prosess Of Production System Flow Chart
- Schematic Diagram Of Production System
- Schematic Diagram Of Production System Sample
- Simple Diagram Of Production System
- Using Schematic Diagram In Production Management
- Explain The Schematic Production System
- Explain Production System Model With Diagram Example
- Diagram Of Production System
- Block Diagram Of Various Production System
- Production System In Industrial Diagram
- Manufacturing 8 Ms fishbone diagram - Template | Milieu Mother ...
- Diagram Of Production
- Draw Schematics Of Production System
- Toyota Production System Timeline
- Production System Chart
- Production System Model With Diagram
- Production System Diagram
- Block Diagram Of Production System
- Schematic Production System
- ERD | Entity Relationship Diagrams, ERD Software for Mac and Win
- Flowchart | Basic Flowchart Symbols and Meaning
- Flowchart | Flowchart Design - Symbols, Shapes, Stencils and Icons
- Flowchart | Flow Chart Symbols
- Electrical | Electrical Drawing - Wiring and Circuits Schematics
- Flowchart | Common Flowchart Symbols
- Flowchart | Common Flowchart Symbols