Process Flowchart


"Causes in the diagram are often categorized, such as to the 6 M's ...
The 6 Ms (used in manufacturing industry):
(1) Machine (technology);
(2) Method (process);
(3) Material (Includes Raw Material, Consumables and Information.);
(4) Man Power (physical work)/ Mind Power (brain work): Kaizens, Suggestions;
(5) Measurement (Inspection);
(6) Milieu/ Mother Nature (Environment).
The original 6Ms used by the Toyota Production System have been expanded by some to include the following and are referred to as the 8Ms. However, this is not globally recognized. It has been suggested to return to the roots of the tools and to keep the teaching simple while recognizing the original intent; most programs do not address the 8Ms.
(7) Management/ Money Power;
(8) Maintenance." [Ishikawa diagram. Wikipedia]
This 8Ms Ishikawa diagram (manufacturing cause and effect diagram) template is included in the Fishbone Diagram solution from the Management area of ConceptDraw Solution Park.
8Ms Ishikawa diagram

Bar Diagrams for Problem Solving. Create manufacturing and economics bar charts with Bar Graphs Solution

How to Build Cloud Computing Diagram Principal Cloud Manufacturing

For documenting the Cloud Computing Architecture with a goal to facilitate the communication between stakeholders are successfully used the Cloud Computing Architecture diagrams. It is convenient and easy to draw various Cloud Computing Architecture diagrams in ConceptDraw PRO software with help of tools of the Cloud Computing Diagrams Solution from the Computer and Networks Area of ConceptDraw Solution Park.
Lean Manufacturing Diagrams
 design elements")
How Do Fishbone Diagrams Solve Manufacturing Problems

ConceptDraw PRO application extended with Fishbone Diagrams solution lets you construct Fishbone diagrams and represent globally recognized standards for manufacturing 6 Ms and 8 Ms.
Flow chart Example. Warehouse Flowchart

Standard warehousing process flow diagram and standard workflow diagram used for process identification for further evaluating effectiveness and profitability of overall business process. Use the ConceptDraw PRO diagramming and vector drawing software extended with the Flowcharts solution from the Diagrams area of ConceptDraw Solution Park to design your own workflow diagrams, process flow diagram and flow charts. Need to use Process Flow Diagram for designing Warehouse packages flow.

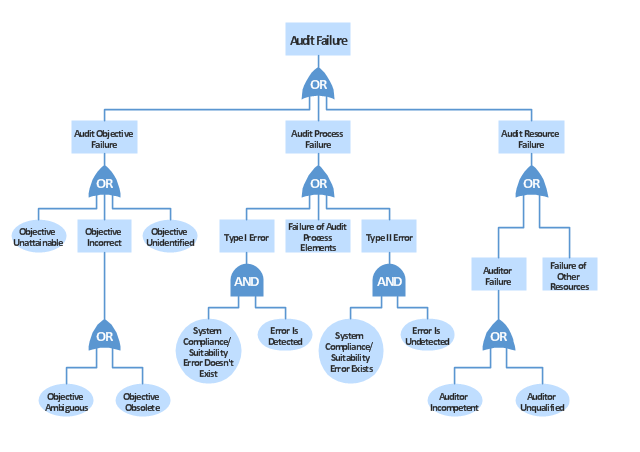
"Failure analysis is the process of collecting and analyzing data to determine the cause of a failure. It is an important discipline in many branches of manufacturing industry, such as the electronics industry, where it is a vital tool used in the development of new products and for the improvement of existing products. There are many companies which provide services to find the cause of failure in products, devices and in post disaster situations. The failure analysis process relies on collecting failed components for subsequent examination of the cause or causes of failure using a wide array of methods, especially microscopy and spectroscopy. The NDT or nondestructive testing methods (such as Industrial computed tomography scanning) are valuable because the failed products are unaffected by analysis, so inspection always starts using these methods." [Failure analysis. Wikipedia]
The example "Audit failure - Fault tree analysis diagram" was created using the ConceptDraw PRO diagramming and vector drawing software extended with the Fault Tree Analysis Diagrams solution from the Engineering area of ConceptDraw Solution Park.
The example "Audit failure - Fault tree analysis diagram" was created using the ConceptDraw PRO diagramming and vector drawing software extended with the Fault Tree Analysis Diagrams solution from the Engineering area of ConceptDraw Solution Park.
FTA diagram
Flowchart on Bank. Flowchart Examples

This sample shows the Flowchart of the Subprime Mortgage Crisis. This Flowchart describes the decline in housing prices when the housing bubble burst and what it caused on the housing and financial markets. You can also see the Government and Industry responses in this crisis situation.

 Fishbone Diagram
Fishbone Diagrams solution extends ConceptDraw PRO software with templates, samples and library of vector stencils for drawing the Ishikawa diagrams for cause and effect analysis.
Types of Flowcharts


Business Process Modeling Notation Template
 B2B process diagram BPMN 2.0 - Cab booking process")
Material Requisition Flowchart. Flowchart Examples

The flowchart example shows the material requisition business process.
The vector stencils library "Workflow diagrams" contains 54 symbol icons of workflow diagrams.
The workflow diagrams represent information flow, automation of business processes, business process re-engineering, accounting, management, and human resources tasks in industry, business, and manufacturing.
Use this library to draw workflow diagrams in the ConceptDraw PRO diagramming and vector drawing software extended with the Workflow Diagrams solution from the Business Processes area of ConceptDraw Solution Park.
www.conceptdraw.com/ solution-park/ business-process-workflow-diagrams
Accounting

Accounts Payable

Accounts Receivable

Bank

Board of Directors

Copy Center

Customer Service

Distribution

Finance

Information Systems

International Division

International Marketing

International Sales

Inventory

Legal Department

Mailroom 2

Mailroom 1

Management

Manufacturing

Marketing

Motor Pool

Packaging

Payroll

Person 1

Person 2

Personnel/ Staff

Publications

Purchasing

Quality Assurance

Exchange

Reception

Research and Development

Sale contract

Shipping

Suppliers

Telecommunications

Treasurer

Warehouse

Lorry

Quality

Production

Box

Boxes

Open box

Payment

Receiving

Sales

Phone

Operator 1

Online booking

Operator 2

Server

Car

Mini truck

- Fishbone Diagram Example For Manufacturing Industry
- Er Diagram For Manufacturing Industry
- Process Flowchart | Data Flow Diagram Model | Manufacturing 8 Ms ...
- Bar Diagrams for Problem Solving. Create manufacturing and ...
- Cause And Effect Diagram For Manufacturing Industry
- Manufacturing 8 Ms fishbone diagram - Template | Business ...
- Bar Diagrams for Problem Solving. Create manufacturing and ...
- Pie Diagram On Manufacturing Industry
- Manufacturing 8 Ms fishbone diagram - Template | Bar Diagrams for ...
- Process Flow Diagram In Manufacturing Industry For Change
- Value-Stream Mapping for Manufacturing | PROBLEM ANALYSIS ...
- Business Productivity Diagramming | Manufacturing 8 Ms fishbone ...
- Fishbone diagram - Production process
- Lean Manufacturing Diagrams | Value-Stream Mapping for ...
- Industrial Process Diagram
- Fishbone Diagram | Manufacturing 8 Ms fishbone diagram ...
- Process Flowchart | TQM Diagram Example | Probability Quality ...
- Fishbone Diagram | Manufacturing 8 Ms fishbone diagram ...
- Fishbone Diagram Example For Service Industry
- Manufacturing 8 Ms fishbone diagram - Template | Total Quality ...
- ERD | Entity Relationship Diagrams, ERD Software for Mac and Win
- Flowchart | Basic Flowchart Symbols and Meaning
- Flowchart | Flowchart Design - Symbols, Shapes, Stencils and Icons
- Flowchart | Flow Chart Symbols
- Electrical | Electrical Drawing - Wiring and Circuits Schematics
- Flowchart | Common Flowchart Symbols
- Flowchart | Common Flowchart Symbols