Process Flowchart


UML Diagram

Create unified modeling language (UML) diagrams with ConceptDraw.
 Computer Network Diagrams
Computer Network Diagrams solution extends ConceptDraw PRO software with samples, templates and libraries of vector icons and objects of computer network devices and network components to help you create professional-looking Computer Network Diagrams, to plan simple home networks and complex computer network configurations for large buildings, to represent their schemes in a comprehensible graphical view, to document computer networks configurations, to depict the interactions between network's components, the used protocols and topologies, to represent physical and logical network structures, to compare visually different topologies and to depict their combinations, to represent in details the network structure with help of schemes, to study and analyze the network configurations, to communicate effectively to engineers, stakeholders and end-users, to track network working and troubleshoot, if necessary.
HelpDesk
How to Create a Bank ATM Use Case Diagram

ConceptDraw PRO diagramming software, enhanced and expanded with the ATM UML Diagrams solution, offers the full range of icons, templates and design elements needed to faithfully represent ATM and banking information system architecture using UML standards. The ATM UML Diagrams solution is useful for beginner and advanced users alike. More experienced users will appreciate a full range of vector stencil libraries and ConceptDraw PRO's powerful software, that allows you to create your ATM UML diagram in a matter of moments.
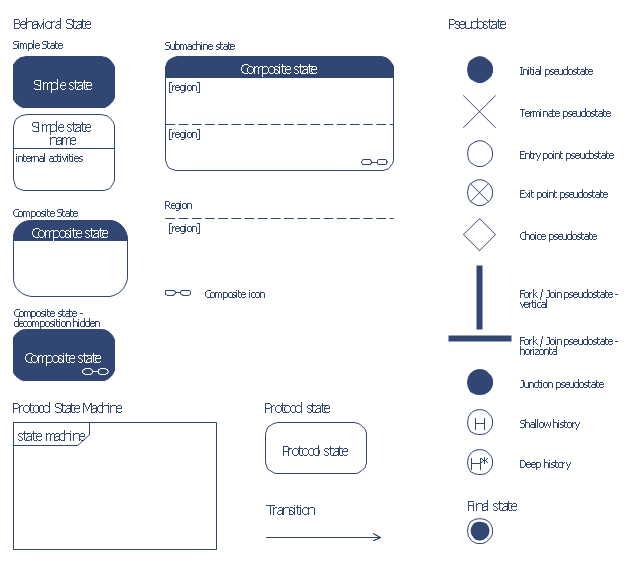
The vector stencils library "Bank UML state machine diagram" contains 21 shapes for drawing UML state machine diagrams.
Use it for object-oriented modeling of your bank information system.
"The state diagram in the Unified Modeling Language is essentially a Harel statechart with standardized notation, which can describe many systems, from computer programs to business processes. In UML 2 the name has been changed to State Machine Diagram. The following are the basic notational elements that can be used to make up a diagram:
* Filled circle, pointing to the initial state.
* Hollow circle containing a smaller filled circle, indicating the final state (if any).
* Rounded rectangle, denoting a state. Top of the rectangle contains a name of the state. Can contain a horizontal line in the middle, below which the activities that are done in that state are indicated.
* Arrow, denoting transition. The name of the event (if any) causing this transition labels the arrow body. A guard expression may be added before a "/ " and enclosed in square-brackets ( eventName[guardExpression] ), denoting that this expression must be true for the transition to take place. If an action is performed during this transition, it is added to the label following a "/ " ( eventName[guardExpression]/ action ).
* Thick horizontal line with either x>1 lines entering and 1 line leaving or 1 line entering and x>1 lines leaving. These denote join/ fork, respectively." [State machine diagram. Wikipedia]
This example of UML state machine diagram symbols for the ConceptDraw PRO diagramming and vector drawing software is included in the ATM UML Diagrams solution from the Software Development area of ConceptDraw Solution Park.
UML state machine diagram symbols
Example of Organizational Chart


 Interactive Voice Response Diagrams
Interactive Voice Response Diagrams solution extends ConceptDraw PRO v10 software with samples, templates and libraries of ready-to-use vector stencils that help create Interactive Voice Response (IVR) diagrams illustrating in details a work of interactive voice response system, the IVR system’s logical and physical structure, Voice-over-Internet Protocol (VoIP) diagrams, and Action VoIP diagrams with representing voice actions on them, to visualize how the computers interact with callers through voice recognition and dual-tone multi-frequency signaling (DTMF) keypad inputs.
UML Use Case Diagram Example. Services UML Diagram. ATM system

This sample shows the scheme of the servicing using the ATMs (Automated Teller Machines) and is used at the working of ATM banking systems, at the performing of the banking transactions.
Communication Diagram UML2.0 / Collaboration UML1.x


 Timeline Diagrams
Timeline Diagrams solution extends ConceptDraw PRO diagramming software with samples, templates and libraries of specially developed smart vector design elements of timeline bars, time intervals, milestones, events, today marker, legend, and many other elements with custom properties, helpful for professional drawing clear and intuitive Timeline Diagrams. Use it to design simple Timeline Diagrams and designate only the main project stages, or highly detailed Timeline Diagrams depicting all project tasks, subtasks, milestones, deadlines, responsible persons and other description information, ideal for applying in presentations, reports, education materials, and other documentation.
 Organizational Charts
Organizational Charts solution extends ConceptDraw PRO software with samples, templates and library of vector stencils for drawing the org charts.
State Diagram Example - Online Store

This sample shows the work of the online store and can be used for the understanding of the online shopping processes, for projection and creating of the online store.
 Cisco Network Diagrams
Cisco Network Diagrams solution extends ConceptDraw PRO with the best characteristics of network diagramming software. Included samples, templates and libraries of built-in standardized vector Cisco network icons and Cisco symbols of computers, network devices, network appliances and other Cisco network equipment will help network engineers, network designers, network and system administrators, as well as other IT professionals and corporate IT departments to diagram efficiently the network infrastructure, to visualize computer networks topologies, to design Cisco computer networks, and to create professional-looking Cisco Computer network diagrams, Cisco network designs and schematics, Network maps, and Network topology diagrams in minutes.
 Entity-Relationship Diagram (ERD)
Entity-Relationship Diagram (ERD) solution extends ConceptDraw PRO software with templates, samples and libraries of vector stencils from drawing the ER-diagrams by Chen's and crow’s foot notations.
- UML use case diagram - Banking system | Process Flowchart ...
- State Mobile Bank Atm System
- Deployment Diagram For Banking Application
- State Diagram Bank Management System
- UML Deployment Diagram Example - ATM System UML diagrams ...
- UML for Bank | ATM UML Diagrams | UML use case diagram ...
- Design elements - Bank UML state machine diagram | How to ...
- State Diagram For Bank Managment System
- ATM UML Diagrams | ATM Solutions | Bank UML Diagram | Atm Uml ...
- Diagram Web Banking
- UML Deployment Diagram Example - ATM System UML diagrams ...
- ATM UML Diagrams | Bank UML Diagram | UML Activity Diagram ...
- State Chart Diagram For Bank
- State Diagram In Uml For Banking System
- Collaboration Diagram In Uml For Banking On Computer
- Use Case Diagram For Banking
- Deployement Diagram For Network Banking System
- ATM UML Diagrams | ATM Solutions | Bank UML Diagram | Atm ...
- How to Create a Bank ATM Use Case Diagram Using ConceptDraw ...
- ATM UML Diagrams | How to Create a Bank ATM Use Case ...
- ERD | Entity Relationship Diagrams, ERD Software for Mac and Win
- Flowchart | Basic Flowchart Symbols and Meaning
- Flowchart | Flowchart Design - Symbols, Shapes, Stencils and Icons
- Flowchart | Flow Chart Symbols
- Electrical | Electrical Drawing - Wiring and Circuits Schematics
- Flowchart | Common Flowchart Symbols
- Flowchart | Common Flowchart Symbols