This Venn diagram sample depicts the path to sustainable development.
"Sustainable development is an organizing principle for human life on a finite planet. It posits a desirable future state for human societies in which living conditions and resource-use meet human needs without undermining the sustainability of natural systems and the environment, so that future generations may also have their needs met.
Sustainable development ties together concern for the carrying capacity of natural systems with the social and economic challenges faced by humanity. As early as the 1970s, 'sustainability' was employed to describe an economy "in equilibrium with basic ecological support systems." Scientists in many fields have highlighted The Limits to Growth, and economists have presented alternatives, for example a 'steady state economy', to address concerns over the impacts of expanding human development on the planet." [Sustainable development. Wikipedia]
The Venn diagram example "Path to sustainable development" was created using the ConceptDraw PRO diagramming and vector drawing software extended with the Venn Diagrams solution from the area "What is a Diagram" of ConceptDraw Solution Park.
Venn diagram

Flowchart Software

ConceptDraw DIAGRAM flowchart software will help to quickly create new flowcharts, workflow, NS Diagram, BPMN Diagram, Cross-functional flowcharts, data flow diagrams and highlight flowcharts.
Feature-rich flowchart maker, free thousand flowchart examples and templates and colored symbols that will allow you to create professional looking flowcharts simply.
ConceptDraw DIAGRAM supports macOS and Windows.

Human Resources
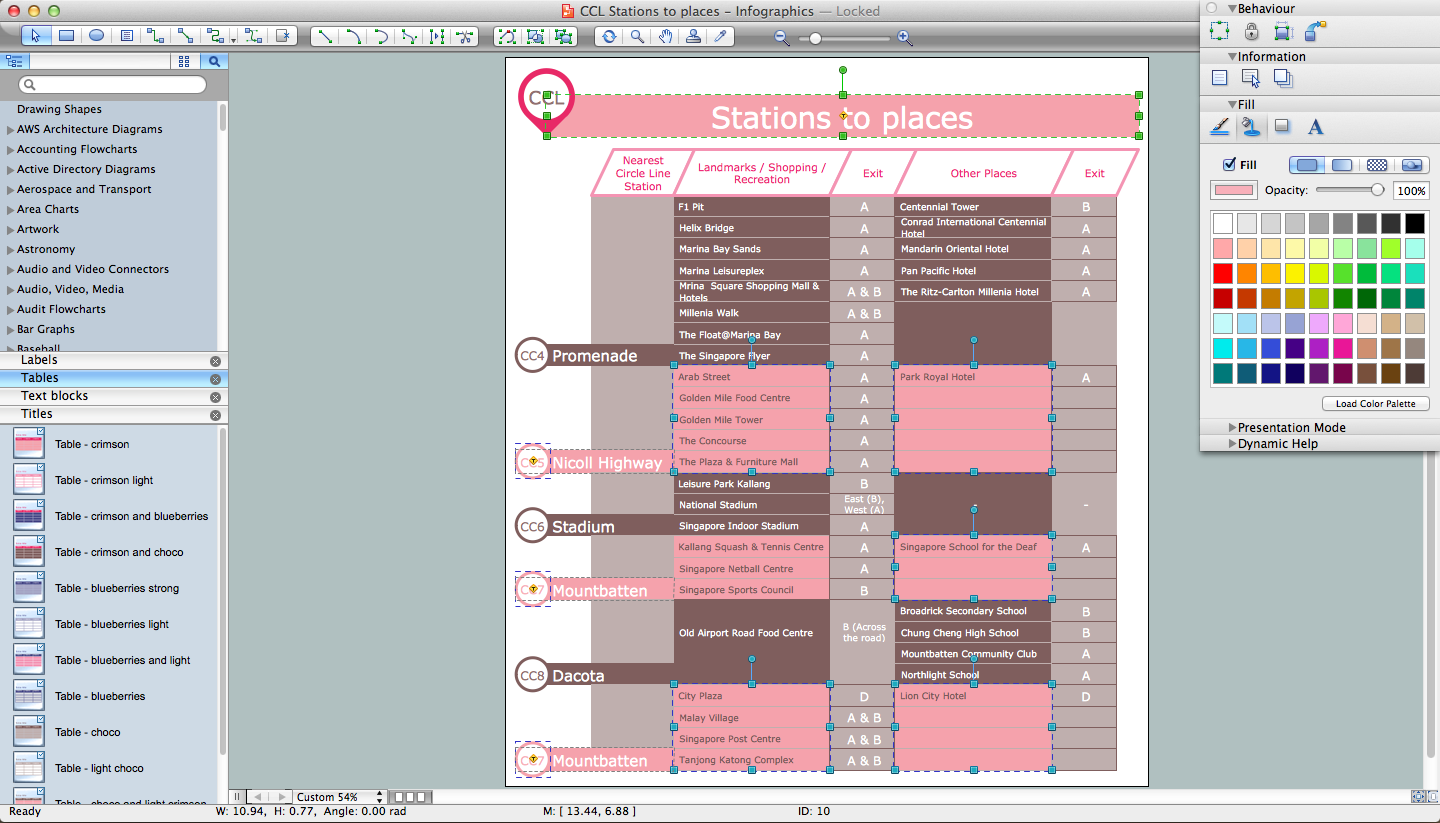
Mini Hotel Floor Plan. Floor Plan Examples

Typography Infographic Examples
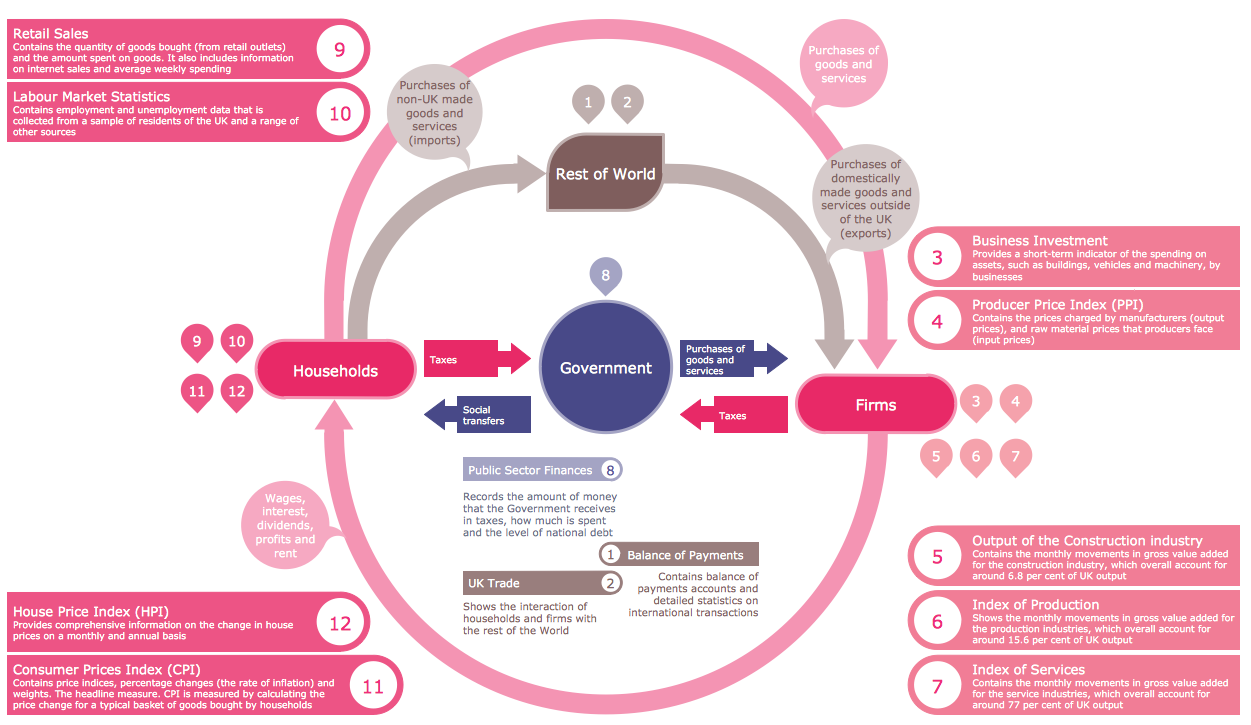
Use of predesigned examples as the base for your own Typography Infographics is a timesaving and useful way. Simply open the desired example, change for your needs and then successfully use it in any field of your activity.
Cloud Computing
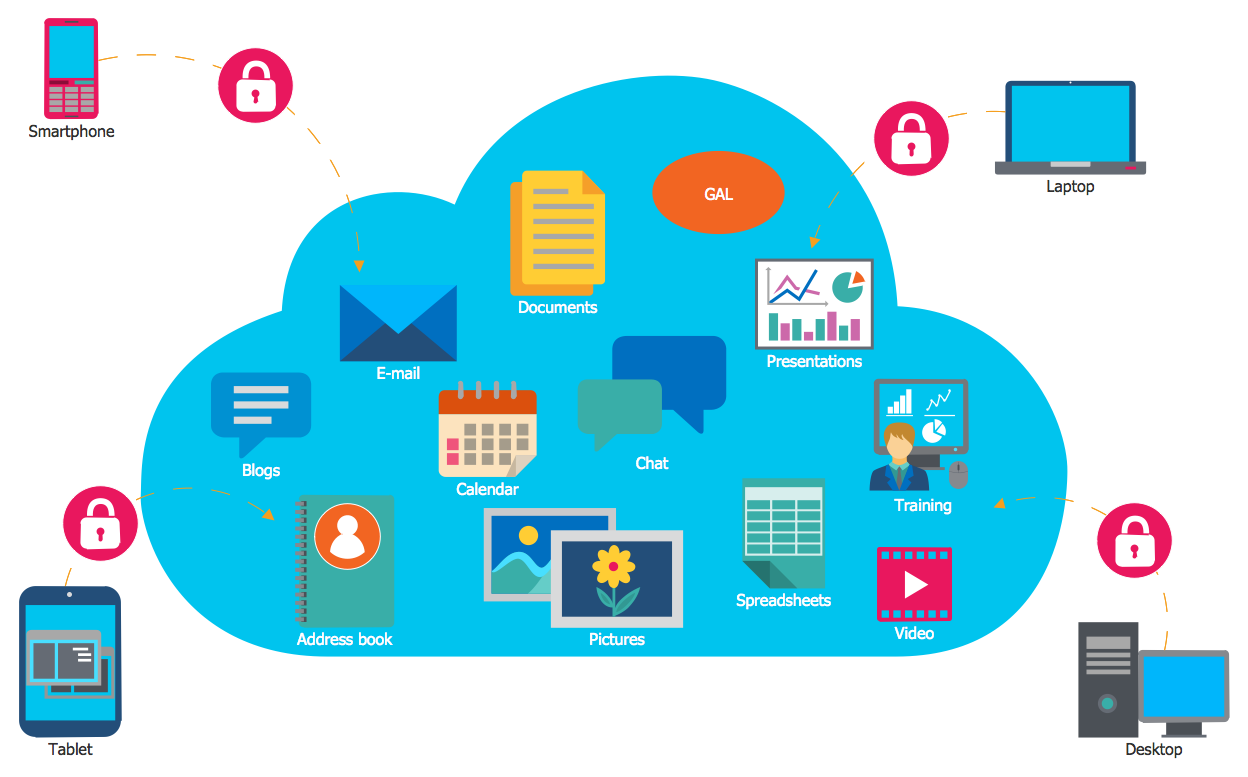
This example was created in ConceptDraw DIAGRAM using the Computer and Networks Area of ConceptDraw Solution Park and shows the Cloud Computing.
Typography Infographic Software
Use the Typography Infographics Solution for ConceptDraw DIAGRAM typography infographic software to create your own professional looking Typography Infographics of any complexity quick, easy and effective, and then successfully use them in various fields.
What is Entity-Relationship Diagram

The vector graphic ER diagrams produced when using ConceptDraw ERD solution can be used in whitepapers, presentations, datasheets, posters, or any technical materials.
Concept Map

How to draw a Concept Map quick, easy and effective? ConceptDraw DIAGRAM offers the unique Concept Maps Solution from the "Diagrams" Area that will help you!
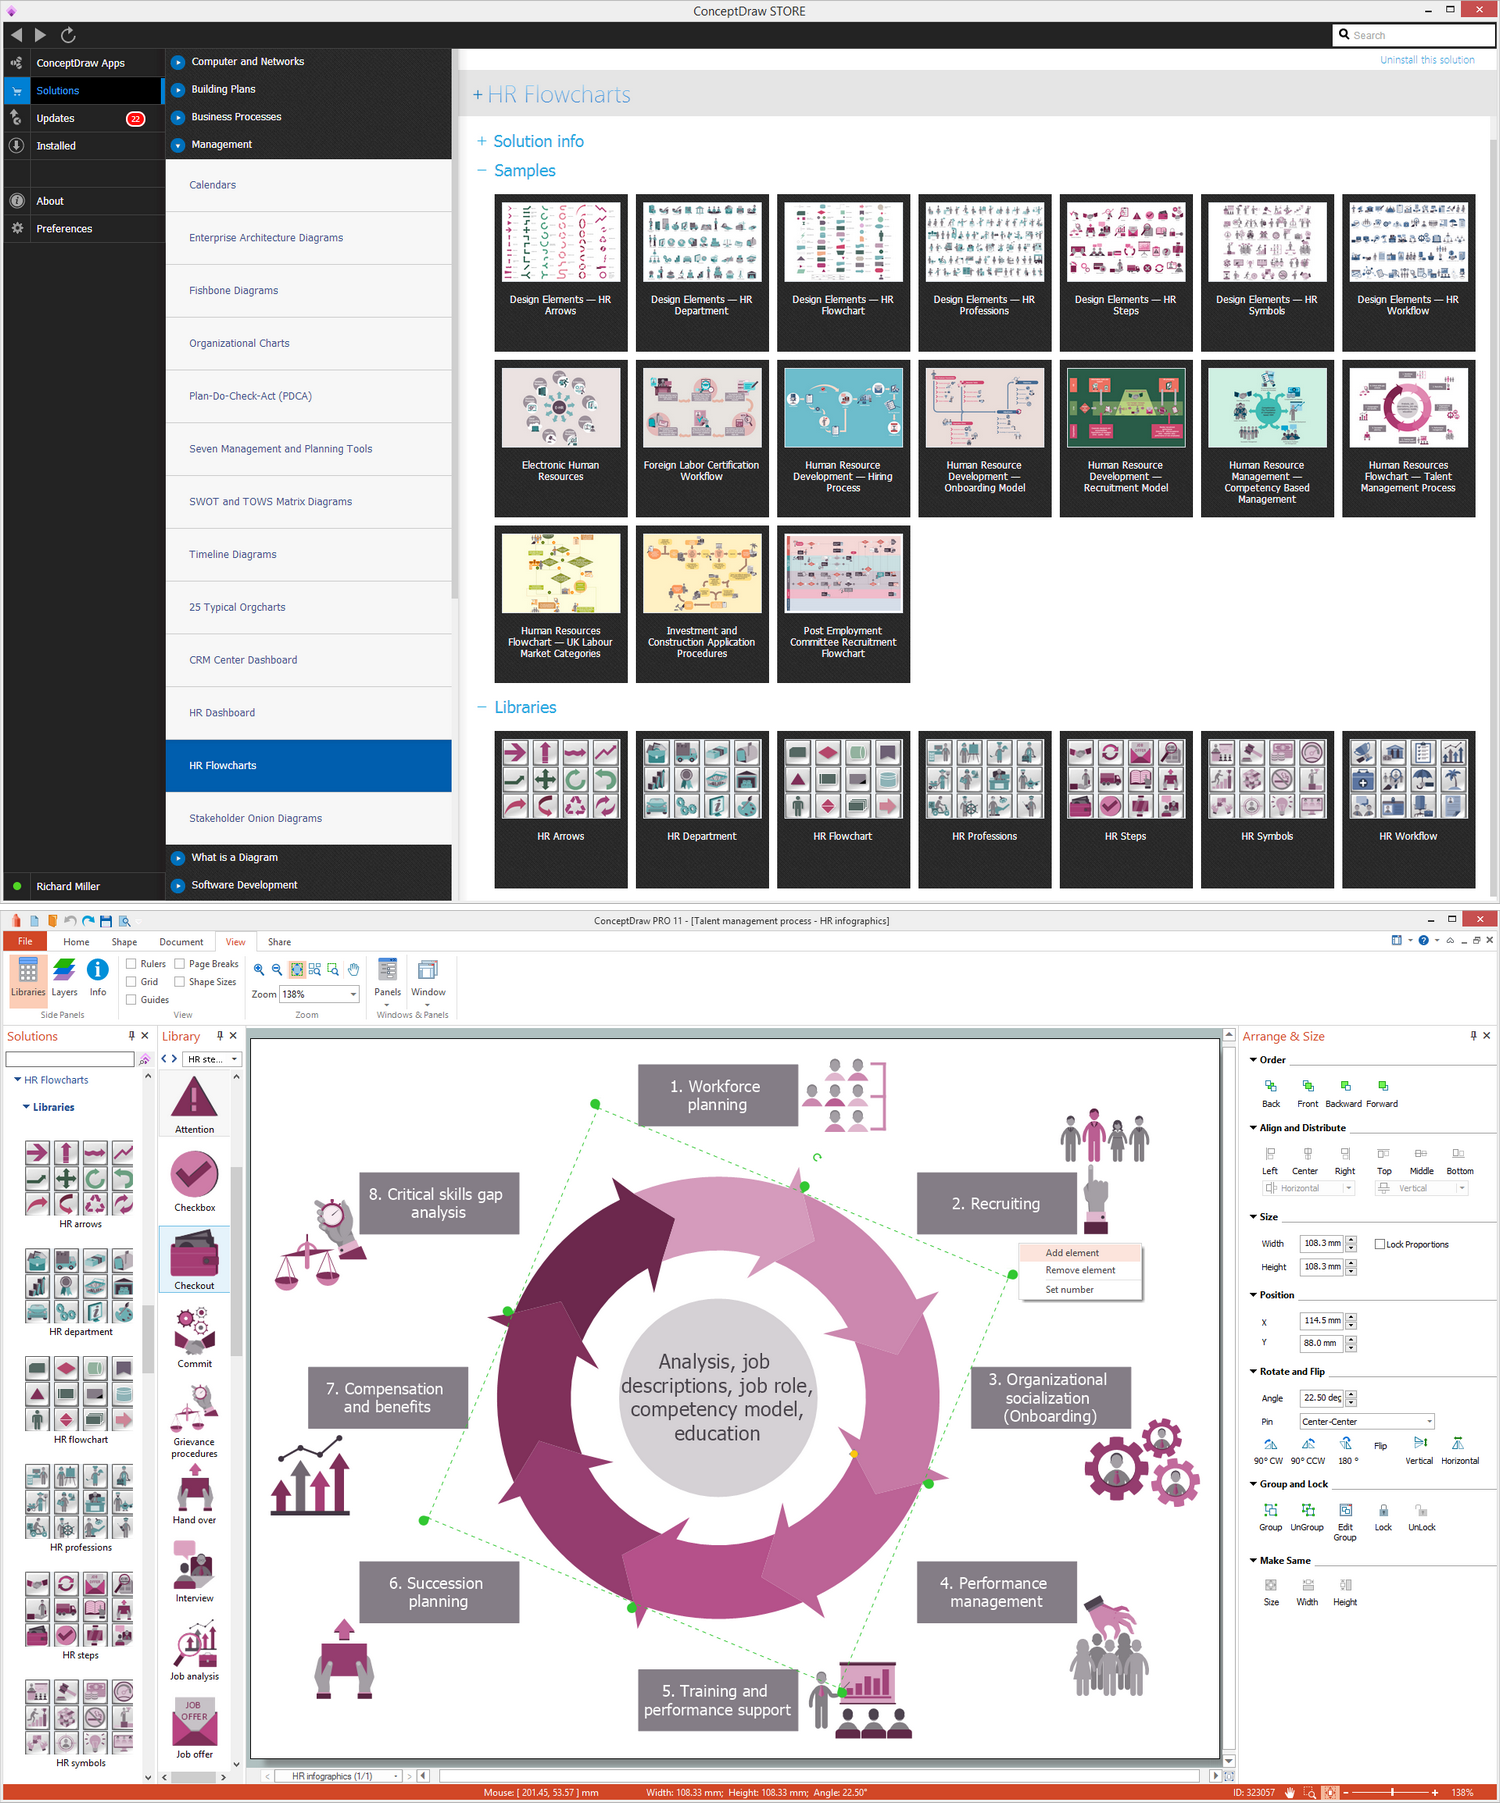
Recruitment

The recruitment process often requires design and use of various HR flowcharts, diagrams, attractive illustrations. Never before their creation wasn’t so easy as now with HR Flowcharts Solution from the Management Area of ConceptDraw Solution Park.
ERD Symbols and Meanings

The Chen's ERD notation is still used and is considered to present a more detailed way of representing entities and relationships.
To create an ERD, software engineers mainly turn to dedicated drawing software, which contain the full notation resources for their specific database design - ERD symbols and meanings. CS Odessa has released an all-inclusive Entity-Relationship Diagram (ERD) solution for their powerful drawing program, ConceptDraw DIAGRAM.

Human Resource Management

Geo Map — USA — Montana
The vector stencils library Montana contains contours for ConceptDraw DIAGRAM diagramming and vector drawing software. This library is contained in the Continent Maps solution from Maps area of ConceptDraw Solution Park.
Geo Map - Canada - Manitoba

The vector stencils library Manitoba contains contours for ConceptDraw DIAGRAM diagramming and vector drawing software. This library is contained in the Continent Maps solution from Maps area of ConceptDraw Solution Park.
Geo Map — Asia — Indonesia
The vector stencils library Indonesia contains contours for ConceptDraw DIAGRAM diagramming and vector drawing software. This library is contained in the Continent Maps solution from Maps area of ConceptDraw Solution Park.
- Green Development Diagram
- Venn diagram - Path to sustainable development | Venn Diagram ...
- Bar Diagrams for Problem Solving. Create economics and financial ...
- Sector diagram - Template | Economic sector weightings | Domestic ...
- Venn diagram - Path to sustainable development | Venn Diagram ...
- Affinity Diagram | Affinity diagram - Implementing continuous ...
- Diagram Of Development
- Process Flowchart | How to Construct a Fishbone Diagram | Flow ...
- Affinity Diagram | How To Create an Affinity Diagram Using ...
- Venn Diagram Examples for Problem Solving. Environmental Social ...
- Bar Diagrams for Problem Solving. Create manufacturing and ...
- How can you illustrate the weather condition | Affinity diagram ...
- Venn Diagram Model Of Sustainable Development
- Sales Process Flowchart. Flowchart Examples | UML Use Case ...
- Affinity Diagram | How To Create an Affinity Diagram Using ...
- Manufacturing 8 Ms fishbone diagram - Template | How Do ...
- Seven Management and Planning Tools | Affinity diagram template ...
- Business Sector Diagram Sample
- Path to sustainable development | Best Program to Make Diagrams ...
- Trading process diagram - Deployment flowchart | Settlement ...
- ERD | Entity Relationship Diagrams, ERD Software for Mac and Win
- Flowchart | Basic Flowchart Symbols and Meaning
- Flowchart | Flowchart Design - Symbols, Shapes, Stencils and Icons
- Flowchart | Flow Chart Symbols
- Electrical | Electrical Drawing - Wiring and Circuits Schematics
- Flowchart | Common Flowchart Symbols
- Flowchart | Common Flowchart Symbols