Best Diagramming Software for macOS


ConceptDraw Arrows10 Technology

This is how diagramming software should work. You are able to draw a diagram as quickly as the ideas come to you.
Flow chart Example. Warehouse Flowchart

Standard warehousing process flow diagram and standard workflow diagram used for process identification for further evaluating effectiveness and profitability of overall business process. Use the ConceptDraw PRO diagramming and vector drawing software extended with the Flowcharts solution from the Diagrams area of ConceptDraw Solution Park to design your own workflow diagrams, process flow diagram and flow charts. Need to use Process Flow Diagram for designing Warehouse packages flow.

 Block Diagrams
Block diagrams solution extends ConceptDraw PRO software with templates, samples and libraries of vector stencils for drawing the block diagrams.
 Bubble Diagrams
Bubble diagrams have enjoyed great success in software engineering, architecture, economics, medicine, landscape design, scientific and educational process, for ideas organization during brainstorming, for making business illustrations, presentations, planning, design, and strategy development. They are popular because of their simplicity and their powerful visual communication attributes.
EPC Diagrams Illustrate Business Process Work Flows

Diagram Software - The Best Choice for Diagramming

Definition TQM Diagram

Quality Management System

Examples of Flowcharts, Org Charts and More


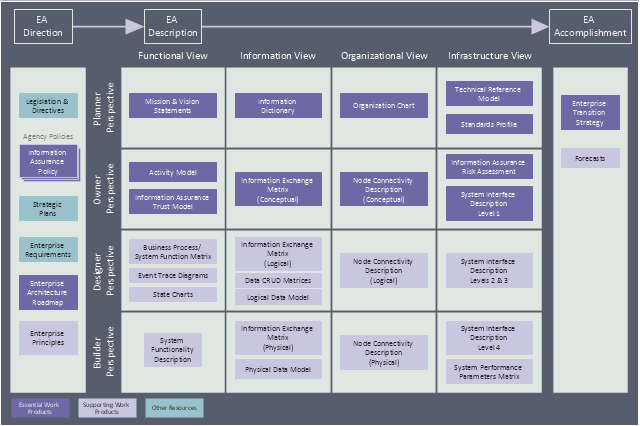
This enterprise architecture diagram sample was redesigned from the Wikipedia file: TEAF Work Products for EA Direction, Description, and Accomplishment.jpg. [en.wikipedia.org/ wiki/ File:TEAF_ Work_ Products_ for_ EA_ Direction,_ Description,_ and_ Accomplishment.jpg]
"Treasury Enterprise Architecture Framework (TEAF) was an Enterprise architecture framework for treasury, based on the Zachman Framework. It was developed by the US Department of the Treasury and published in July 2000. May 2012 this framework has been subsumed by evolving Federal Enterprise Architecture Policy as documented in "The Common Approach to Federal Enterprise Architecture".
The material presented here is obsolete and only useful for historical reference and is not the current policy in use by the Department of the Treasury." [en.wikipedia.org/ wiki/ Treasury_ Enterprise_ Architecture_ Framework]
The enterprise architecture diagram example "Resources and TEAF Work Products for EA Direction, Description, and Accomplishment" was created using the ConceptDraw PRO diagramming and vector drawing software extended with the Enterprise Architecture Diagrams solution from the Management area of ConceptDraw Solution Park.
Enterprise architecture diagram
Bubble Charts

 Entity-Relationship Diagram (ERD)
Entity-Relationship Diagram (ERD) solution extends ConceptDraw PRO software with templates, samples and libraries of vector stencils from drawing the ER-diagrams by Chen's and crow’s foot notations.
- Concept Map On The Characteristics Of Business Policy
- Examples Of Diagram Of Business Policy
- Concept Mapping In Business Policy
- Business Policy Concept Map
- Draw For Business Policy
- Process Of Business Policy Through Diagram
- Diagram Of Business Policy
- Management Direction Diagrams
- Network Security Tips | Network Security Model | Network Security ...
- Bubble diagram - Employment policy direction | Best Diagramming ...
- TQM Diagram Example | Probability Quality Control Tools | TQM ...
- Employment Form Software | Post Employment Committee ...
- Enterprise Architecture Diagrams | Fault Tree Analysis Diagrams | Er ...
- Main Characteristics Of Business With Example For Each
- Business Park Bubble Diagrams
- Organizational Structure | Active Directory Domain Services diagram ...
- Direction In Management Diagram
- Taxi service order procedure - BPMN 1.2 diagram | Taxi order ...
- Concept Maps | Concept Map Maker | How To Make a Concept Map ...
- What Can I Draw That Represents A Product Of Each Business Sector
- ERD | Entity Relationship Diagrams, ERD Software for Mac and Win
- Flowchart | Basic Flowchart Symbols and Meaning
- Flowchart | Flowchart Design - Symbols, Shapes, Stencils and Icons
- Flowchart | Flow Chart Symbols
- Electrical | Electrical Drawing - Wiring and Circuits Schematics
- Flowchart | Common Flowchart Symbols
- Flowchart | Common Flowchart Symbols