This site uses cookies. By continuing to browse the ConceptDraw site you are agreeing to our Use of Site Cookies.

accounting flowchart, accounting cycle Accounting Flowcharts

accounting flowchart, accounting cycle
Accounting Flowcharts solution extends ConceptDraw DIAGRAM software with templates, samples and library of vector stencils for drawing the accounting flow charts.

How to Create Flowcharts for an Accounting Information System

Accounting information is a system of processes to represent financial and accounting data that is used by decision makers. To represent accounting processes there are special symbols which are used to create accounting flowcharts.
Flowcharts help users of Accounting Information System to understand the step sequences of accounting processes. Use ConceptDraw DIAGRAM with Accounting Flowcharts solution to document and communicate visually how accounting processes work, and how each operation is done.

Steps of Accounting Cycle

The steps of accounting cycle include the processes of identifying, collecting, analyzing documents, recording transactions, classifying, summarizing, posting, and preparing trial balance, making journal entries, closing the books and final reporting financial information of an organization.
Use the ConceptDraw DIAGRAM with Accounting Flowcharts Solution to create your own professional Accounting Flowcharts of any complexity quick and easy.

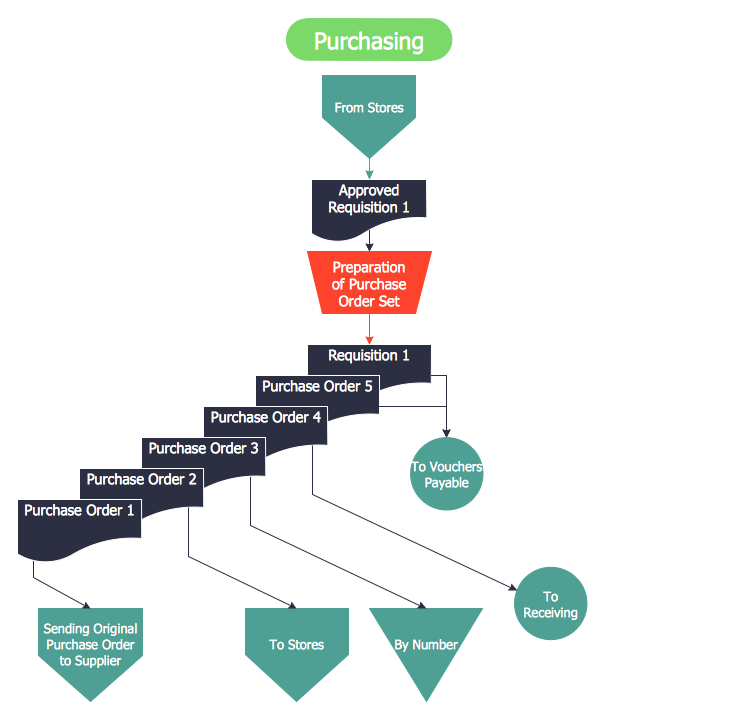
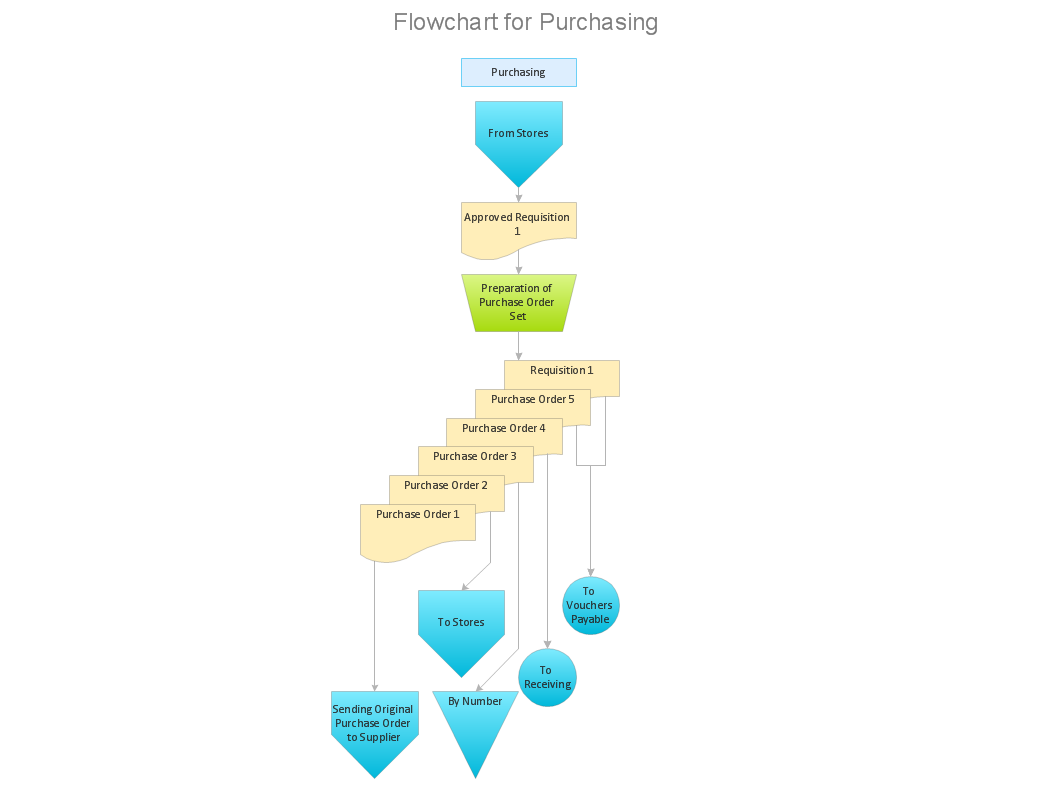
Workflow to Make a Purchase. Accounting Flowchart Example

Purchasing Workflow Chart as a methods for documenting accounting information systems. Symbols and Methods for designing Accounting System.
HelpDesk

Accounting Information Systems Flowchart Symbols

An accounting Information system is a combination of software and hardware, as well as organizational support. Information system - it is not only the software and computers with network equipment but also a list of instructions and standards which can be notated using Accounting information systems flowchart symbols. All information systems can be divided into information retrieval and data processing systems. The data Flow model is a hierarchical model. Each process can be divided into structural components, that depict by corresponding flowchart symbols, showing the accounting information system in communication with the external environment. The major components of an accounting information systems flowchart are entities, processes, data stores, and data flows. The set of standard accounting information flowchart symbols is intended to show the relationships between the system components. ConceptDraw DIAGRAM can help to draw clear accounting information system diagrams using special flowchart symbols.

Accounting Flowchart Symbols

If you deal everyday with accounting procedures, you might come to that point when you have to draw an accounting flowchart mentioning all the necessary details for getting the right result and in order to succeed in your field of business activity. Making it is truly simple in case you have ConceptDraw DIAGRAM which is a unique software that allows you to create any kinds of charts and flowcharts as well as schemes, diagrams and plans. This product is so special that once you start using it, you will understand the way it works quick and will never need any other software for the purpose of creating all mentioned above to see as a result incredible, smart, professional, sophisticated flowchart.
HelpDesk

How to Create an Accounting Flowchart

An Accounting flowchart is a specialized type of flowchart. With the help of an accounting flowchart, you can visually describe tasks, documents, people responsible for execution at each stage of the accounting workflow. Find out how you can easily create an accounting flowchart of any complexity using Accounting Flowchart Solution from the ConceptDraw Solution Park.

Flowchart Symbols Accounting. Activity-based costing (ABC) flowchart

This flow chart example represent activity-based costing flowchart (ABC flowchart): resource-catagories, resource cost drivers, activities, activity cost drivers, cost objects, direct materials, direct labour. This sort of accounting flowcharts intended to explain how costs distributed between company units and departments. There is only way to clearly explain activity-based cost distribution - create cost diagram demonstrating cost distribution relations and logics. ConceptDraw DIAGRAM is special software with accounting flowchart symbols and flowchart stencils for effective drawing activity-based cost flowcharts (ABC-flowcharts).

Accounts Payable Flowchart

Accounts Payable Flowchart - There is nothing easier than do it in ConceptDraw DIAGRAM. ConceptDraw DIAGRAM diagramming and vector drawing software provides the Accounting Flowcharts Solution from the Finance and Accounting Area of ConceptDraw Solution Park.
The Accounting Flowcharts Solution contains templates, samples and library of ready-to-use predesigned vector objects that will help you create: accounts payable flowchart, accounts payable process flow chart, accounting flowchart of any complexity quick and easy.

Steps in the Accounting Process

Steps in the Accounting Process - The Accounting Process is a sequence of organization activities that is used for gaining quantitative information about the finances. This complex process consists of a set of sequential steps.
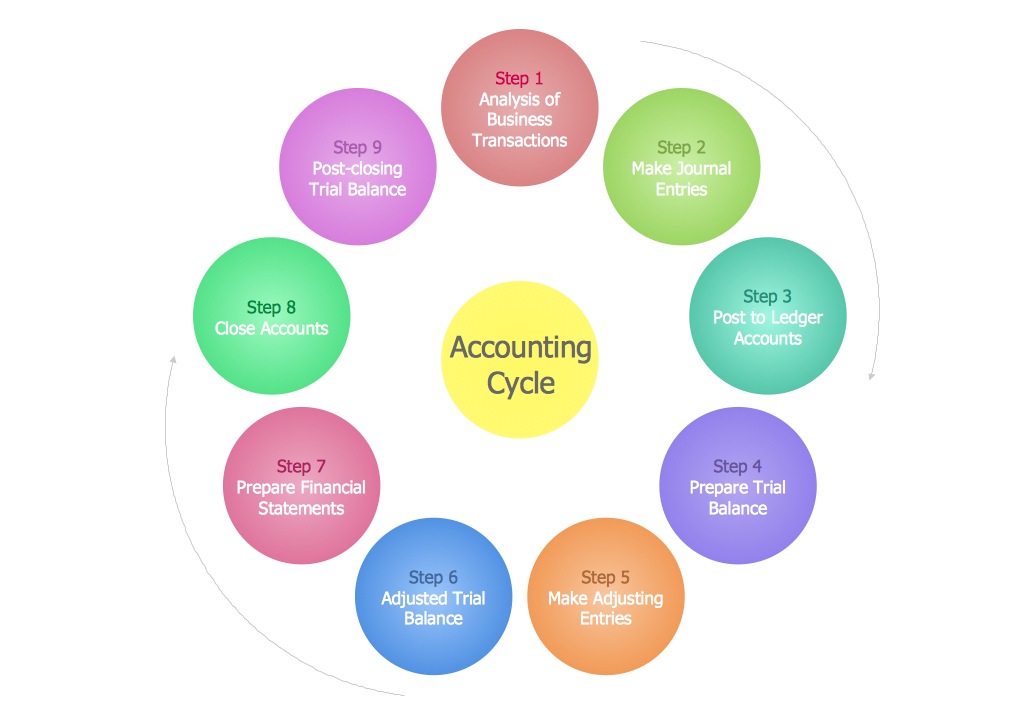
9 steps in the accounting process: Analysis of Business Transactions, Make Journal Entries, Post to Ledger Accounts, Prepare Trial Balance, Make Adjusting Entries, Adjusted Trial Balance, Prepare Financial Statements, Close Accounts, Post-Closing Trial Balance.

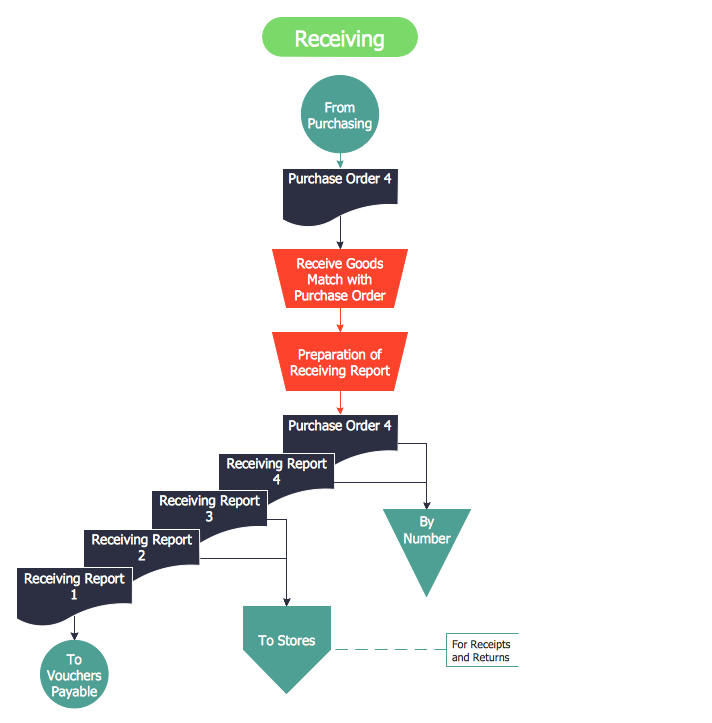
Purchase Process Flow Chart, Receiving Process Flow Chart, Accounting Flowchart Example.

The purchasing process follows very specific guidelines and includes a purchasing cycle flowchart and receiving process flow chart. Common key elements of purchasing process.
It is important to know how purchasing processes work and how each operation is done.

Data Flow Diagram

Data flow diagram (DFD) is the part of the SSADM method (Structured Systems Analysis and Design Methodology), intended for analysis and information systems projection. Data flow diagrams are intended for graphical representation of data flows in the information system and for analysis of data processing during the structural projection. Data flow diagram often used in connection with human process and can be displayed as workflow diagram. The critical Process Flow Diagram is another flowchart technique for designing data flow in connection with organizational processes. The critical Process flow diagram may use different range of symbols than a classic workflow diagram.

What is the Accounting Cycle?

What is the accounting cycle? The accounting cycle is a sequence of steps that occur in the accounting period and include the processes of identifying, collecting, analyzing documents, recording transactions, classifying, summarizing, and reporting financial information of an organization.

Accounting Flowchart

Accounting flowchart is a system of processes to represent accounting system of an organization. If you need to know how accounting processes work and how each operation is done, the Accounting Flowcharts Solution for ConceptDraw DIAGRAM has a predesigned library, tips, methods and symbols for easy drawing an Accounting Flowchart.

Accounting Flowchart Purchasing Receiving Payable and Payment

Accounting flowchart is a pictorial way to represent the flow of data in an organization and the flow of transactions process in a specific area of its accounting or financial department. Accounting Flowcharts solution contains the full set of standardized accounting flowchart symbols which will help you design in minutes various types of Accounting Flowcharts including such popular diagrams which represent the whole accounting process: Purchasing Flowchart, Receiving Flowchart, Voucher Payable Flowchart, Treasurer Flowchart, Payment Flowchart.