A four level pyramid model of different types of Information Systems based on the different levels of hierarchy in an organization. The first level represents transaction processing systems for workers. The second level represents management information systems for middle managers. The third level represents decision support systems for senior menegers. The fourth level represents executive information systems for executives.
"The "classic" view of Information systems found in the textbooks in the 1980s was of a pyramid of systems that reflected the hierarchy of the organization, usually transaction processing systems at the bottom of the pyramid, followed by management information systems, decision support systems, and ending with executive information systems at the top. Although the pyramid model remains useful, since it was first formulated a number of new technologies have been developed and new categories of information systems have emerged, some of which no longer fit easily into the original pyramid model.
Some examples of such systems are:
data warehouses,
enterprise resource planning,
enterprise systems,
expert systems,
search engines,
geographic information system,
global information system,
office automation." [Information systems. Wikipedia]
This diagram was redesigned using the ConceptDraw PRO diagramming and vector drawing software from Wikimedia Commons file Four-Level-Pyramid-model.png. [commons.wikimedia.org/ wiki/ File:Four-Level-Pyramid-model.png]
This file is licensed under the Creative Commons Attribution-Share Alike 3.0 Unported license. [creativecommons.org/ licenses/ by-sa/ 3.0/ deed.en]
The triangle chart example "Information systems types" is included in the Pyramid Diagrams solution from the Marketing area of ConceptDraw Solution Park.
Pyramid diagram

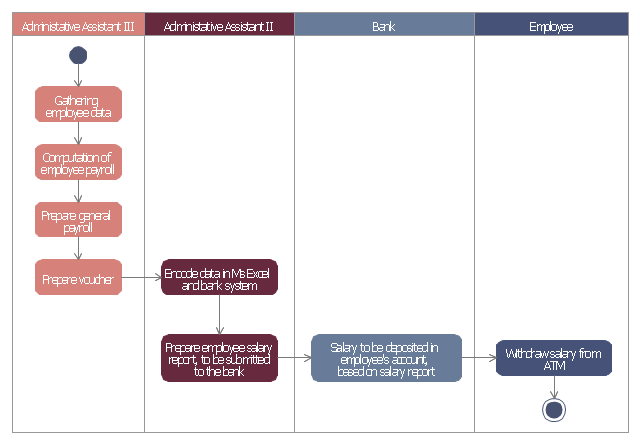
This example of automated payroll management system UML activity diagram was created on the base of figure on the webpage "Automated payroll management system" from ethelmandane.wikispaces.com.
"In the Philippines and in other foreign countries the government has a trend to embrace automation for process efficiency. One of the processes that are being automated is the payroll process. Payroll is the total amount required to pay workers and employees during a week, month or other period.
One of the government offices that desires to automate their payroll system is the NSO Camarines Sur which is located 2nd Floor MMCN Building, Panganiban Avenue, Naga City. The National Statistics Office (NSO) envisions to be recognized as a world-class provider of statistical and civil registration products and services and lives with its mission to produces and provides quality statistical and civil registration products and services. ...
The project seeks to create an Information System Plan for an Automated Payroll Management System. ...
The creation of the Information System Plan will benefit the accounting section of the organization. Specifically it is significant to:
1. Administrative Assistants. It will help to lessen time and effort in preparing and computing the salary of the employee.
2. NSO. It will help the organization to be more productive and efficient."
[ethelmandane.wikispaces.com/ ]
This file is licensed under a Creative Commons Attribution Share-Alike 3.0 License. [creativecommons.org/ licenses/ by-sa/ 3.0/ ]
This UML activity diagram example modeling the automated payroll management system using automated teller machine (ATM) was created using the ConceptDraw PRO diagramming and vector drawing software extended with the ATM UML Diagrams solution from the Software Development area of ConceptDraw Solution Park.
UML activity diagram of automated payroll management system using ATM
Basic Flowchart Symbols and Meaning


Workflow Diagram

The workflow represents the transferring of data, documents or tasks during a work process. To make it easier to study and analyze working processes, and to present them in a simple visual manner, workflow diagrams are used. To create these diagrams professional use workflow diagram maker software ConceptDraw PRO.
Workflow Diagram Examples

 Business Process Workflow Diagrams
The Business Process Workflow Diagrams solution enhances the ConceptDraw PRO v10 functionality with predesigned examples, samples and a numerous collection of predesigned vector objects of workflow chart elements, icons, arrows, connectors, and varied wor
How To Create a Workflow Diagram

The fastest way to create a workflow diagram is using pre-designed workflow template. ConceptDraw PRO with the Workflow Diagrams solution delivers rich set of workflow diagram templates you may start from.
FSM — Finite-state Machine

Work Flow Process Chart

 Cross-Functional Flowcharts
Cross-functional flowcharts are powerful and useful tool for visualizing and analyzing complex business processes which requires involvement of multiple people, teams or even departments. They let clearly represent a sequence of the process steps, the order of operations, relationships between processes and responsible functional units (such as departments or positions).
Flow chart Example. Warehouse Flowchart

Standard warehousing process flow diagram and standard workflow diagram used for process identification for further evaluating effectiveness and profitability of overall business process. Use the ConceptDraw PRO diagramming and vector drawing software extended with the Flowcharts solution from the Diagrams area of ConceptDraw Solution Park to design your own workflow diagrams, process flow diagram and flow charts. Need to use Process Flow Diagram for designing Warehouse packages flow.

 Event-driven Process Chain Diagrams
Event-driven Process Chain (EPC) Diagram is a type of flowchart widely used for modeling in business engineering and reengineering, business process improvement, and analysis. EPC method was developed within the Architecture of Integrated Information Systems (ARIS) framework.
ConceptDraw Arrows10 Technology

"Tree"- mode drawing works like that. Just select objects in your drawing and press Tree or Chain button to connect all of them just in one click.
Your diagram looks professional and it took only a moment to draw.
Developing Entity Relationship Diagrams
, crow's foot notation")
Most entity-relationship diagrams can be built with objects from Flowchart solution or ERD Solution which contains inbuilt templates. Follow these steps to create your own custom ERD diagram.
Don't be frightened if it looks complex, ConceptDraw PRO makes it easy to create an ERD, and hundreds of other diagrams, in minutes.
- Diagram Of Office Automation System
- Data Flow Diagram For Office Automation System
- Models Of Office Automation System
- Hierarchy Of Office Automation System
- Flow Chart Of Office Automation
- Diagram For Office Automation System
- Draw The Diagram Of Office Automation System
- Use Case Diagram Of Office Automation System
- Pyramid Diagram | 4 Level pyramid model diagram - Information ...
- Office Automation Sys Diagram In Info Sys
- Er Diagrams Auditor Office Automation System
- Flow Chart Of The Components Of Office Automation
- Process Flowchart | Dfd Office Automation System
- 4 Level pyramid model diagram - Information systems types ...
- Diagram Concept Of The Automated Information System
- Automated payroll management system UML activity diagram ...
- Office Automation System Definition
- Automated Workflow System
- Automated payroll management system UML activity diagram | Basic ...
- Workflow Automation System
- ERD | Entity Relationship Diagrams, ERD Software for Mac and Win
- Flowchart | Basic Flowchart Symbols and Meaning
- Flowchart | Flowchart Design - Symbols, Shapes, Stencils and Icons
- Flowchart | Flow Chart Symbols
- Electrical | Electrical Drawing - Wiring and Circuits Schematics
- Flowchart | Common Flowchart Symbols
- Flowchart | Common Flowchart Symbols