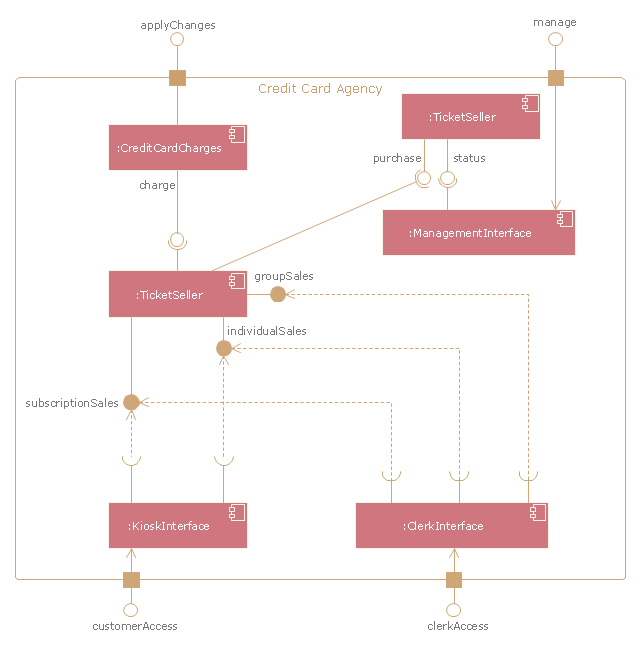
"A credit card is a payment card issued to users as a system of payment. It allows the cardholder to pay for goods and services based on the holder's promise to pay for them. The issuer of the card creates a revolving account and grants a line of credit to the consumer (or the user) from which the user can borrow money for payment to a merchant or as a cash advance to the user." [Credit card. Wikipedia]
The UML component diagram example "Credit card agency" was created using the ConceptDraw PRO diagramming and vector drawing software extended with the Rapid UML solution from the Software Development area of ConceptDraw Solution Park.
The UML component diagram example "Credit card agency" was created using the ConceptDraw PRO diagramming and vector drawing software extended with the Rapid UML solution from the Software Development area of ConceptDraw Solution Park.
UML component diagram
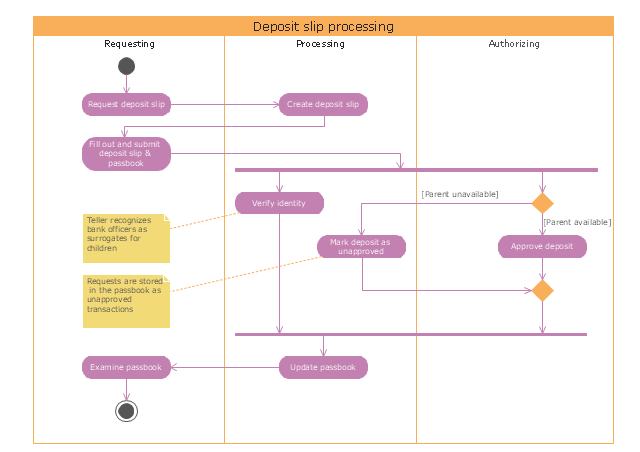
"Credits and deposits.
To add credit to an account by bringing cash to a bank in person, the account holder can fill a small credit slip or deposit slip. The total amount of each note and coin is counted and entered on the slip, along with who it is paid in by and the date. The cash and details are counted and checked by the teller at the bank, if everything is in order the deposit is credited to the account, the credit slip is then kept by the bank and the credit slip booklet is stamped with the date and then returned to the account holder.An account holder uses their passbook to record their history of transactions with their bank." [Passbook. Wikipedia]
The UML activity diagram example "Deposit slip processing" was created using the ConceptDraw PRO diagramming and vector drawing software extended with the Rapid UML solution from the Software Development area of ConceptDraw Solution Park.
UML activity diagram
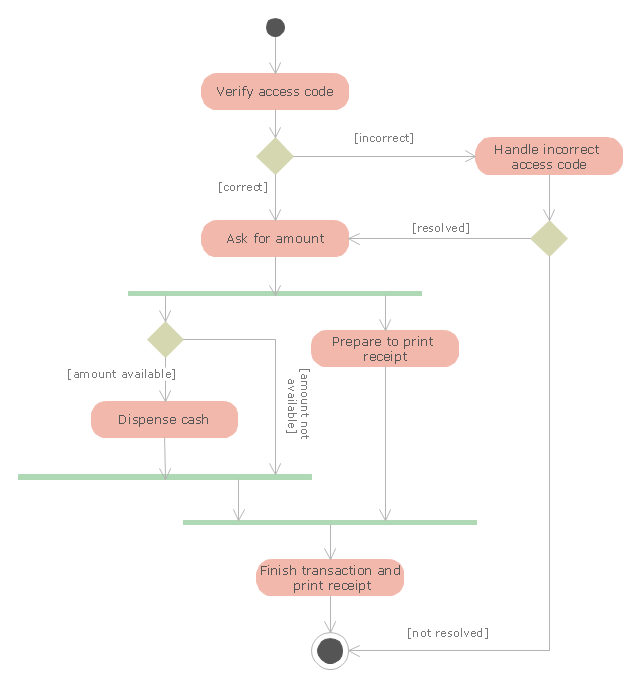
"An automated teller machine or automatic teller machine" (ATM) (American, Australian, Singaporean, Indian, and Hiberno-English), also known as an automated banking machine (ABM) (Canadian English), cash machine, cashpoint, cashline or hole in the wall (British, South African, and Sri Lankan English), is an electronic telecommunications device that enables the clients of a financial institution to perform financial transactions without the need for a cashier, human clerk or bank teller.
On most modern ATMs, the customer is identified by inserting a plastic ATM card with a magnetic stripe or a plastic smart card with a chip that contains a unique card number and some security information such as an expiration date or CVVC (CVV). Authentication is provided by the customer entering a personal identification number (PIN). The newest ATM at Royal Bank of Scotland allows customers to withdraw cash up to £100 without a card by inputting a six-digit code requested through their smartphones.
Using an ATM, customers can access their bank accounts in order to make cash withdrawals, get debit card cash advances, and check their account balances as well as purchase pre-paid mobile phone credit. If the currency being withdrawn from the ATM is different from that which the bank account is denominated in (e.g.: Withdrawing Japanese yen from a bank account containing US dollars), the money will be converted at an official wholesale exchange rate. Thus, ATMs often provide one of the best possible official exchange rates for foreign travellers, and are also widely used for this purpose." [Automated teller machine. Wikipedia]
The UML activity diagram example "Cash withdrawal from ATM" was created using the ConceptDraw PRO diagramming and vector drawing software extended with the Rapid UML solution from the Software Development area of ConceptDraw Solution Park.
UML activity diagram
 Fishbone Diagram
Fishbone Diagrams solution extends ConceptDraw PRO software with templates, samples and library of vector stencils for drawing the Ishikawa diagrams for cause and effect analysis.
 Entity-Relationship Diagram (ERD)
Entity-Relationship Diagram (ERD) solution extends ConceptDraw PRO software with templates, samples and libraries of vector stencils from drawing the ER-diagrams by Chen's and crow’s foot notations.
 Event-driven Process Chain Diagrams
Event-driven Process Chain (EPC) Diagram is a type of flowchart widely used for modeling in business engineering and reengineering, business process improvement, and analysis. EPC method was developed within the Architecture of Integrated Information Systems (ARIS) framework.
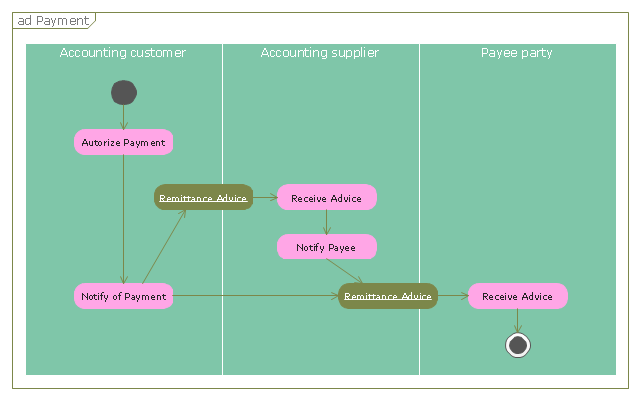
"A payment is the transfer of an item of value from one party (such as a person or company) to another in exchange for the provision of goods, services or both, or to fulfill a legal obligation. ...
Payment methods.
There are two types of payment methods; exchanging and provisioning. Exchanging is to change coin, money and banknote in terms of the price. Provisioning is to transfer money from one account to another. In this method, a third party must be involved. Credit card, debit card, Cheques, money transfers, and recurring cash or ACH (Automated Clearing House) disbursements are all electronic payments methods. Electronic payments technologies are magnetic stripe card, smartcard, contactless card and mobile handset. Mobile handset based payments are called mobile payments." [Payment. Wikipedia]
The UML activity diagram example "Payment process" was created using the ConceptDraw PRO diagramming and vector drawing software extended with the Rapid UML solution from the Software Development area of ConceptDraw Solution Park.
UML activity diagram
 Fishbone Diagrams
The Fishbone Diagrams solution extends ConceptDraw PRO v10 software with the ability to easily draw the Fishbone Diagrams (Ishikawa Diagrams) to clearly see the cause and effect analysis and also problem solving. The vector graphic diagrams produced using this solution can be used in whitepapers, presentations, datasheets, posters, and published technical material.
 AWS Architecture Diagrams
The flexible AWS cloud solutions will help you to create reliable applications with a high level of scaling in the AWS cloud, to run your applications and accelerate their work on the level of security. Besides AWS resources are available worldwide and yo
 Cross-Functional Flowcharts
Cross-functional flowcharts are powerful and useful tool for visualizing and analyzing complex business processes which requires involvement of multiple people, teams or even departments. They let clearly represent a sequence of the process steps, the order of operations, relationships between processes and responsible functional units (such as departments or positions).
 Business Process Diagrams
Business Process Diagrams solution extends the ConceptDraw PRO BPM software with RapidDraw interface, templates, samples and numerous libraries based on the BPMN 1.2 and BPMN 2.0 standards, which give you the possibility to visualize equally easy simple and complex processes, to design business models, to quickly develop and document in details any business processes on the stages of project’s planning and implementation.
 Value Stream Mapping
Value stream mapping solution extends ConceptDraw PRO software with templates, samples and vector stencils for drawing the Value Stream Maps (VSM) in lean manufacturing practice.
- Credit Card Processing System UML Diagram | UML activity ...
- UML component diagram - Credit card agency | Money - Design ...
- Credit Card Processing System UML Diagram | Bank System | UML ...
- Credit Card Processing System UML Diagram | Credit Card Order ...
- Credit Card Processing System UML Diagram | UML in 10 mins ...
- Credit Card Processing System UML Diagram | UML activity ...
- UML activity diagram - Cash withdrawal from ATM | UML activity ...
- Activity Diagrams For Cash Deposit
- Internet symbols - Vector stencils library | UML activity diagram ...
- Bank Sequence Diagram | UML Deployment Diagram Example ...
- UML Activity Diagram | Business Process Elements: Activities ...
- UML activity diagram - Cash withdrawal from ATM | UML Activity ...
- Bank Activity Diagram
- UML activity diagram - Cash withdrawal from ATM | UML Activity ...
- UML activity diagram - Cash withdrawal from ATM | UML class ...
- Credit Card Withdrawal Erd Diagram
- Class UML Diagram for Bank Account System | UML class diagram ...
- UML for Bank | ATM UML Diagrams | UML use case diagram ...
- UML component diagram - Credit card agency | Rapid UML | Rapid ...
- Credit Card Processing System UML Diagram | Bank System | UML ...
- ERD | Entity Relationship Diagrams, ERD Software for Mac and Win
- Flowchart | Basic Flowchart Symbols and Meaning
- Flowchart | Flowchart Design - Symbols, Shapes, Stencils and Icons
- Flowchart | Flow Chart Symbols
- Electrical | Electrical Drawing - Wiring and Circuits Schematics
- Flowchart | Common Flowchart Symbols
- Flowchart | Common Flowchart Symbols