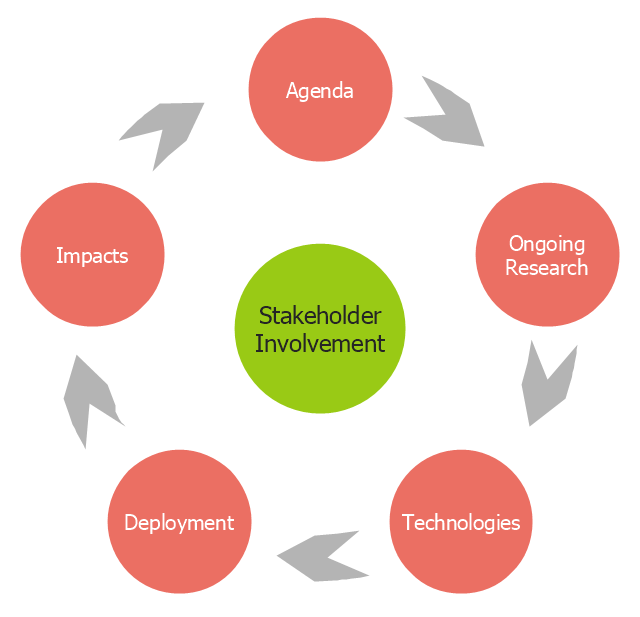
This arrow loop cycle diagram sample was created on the base of the figure illustrating the webpage "Exploratory Advanced Research Program Hand-Off Workshops" from the US Department of Transportation - Federal Highway Administration (FHWA) website. "The FHWA’s research and technology innovation life cycle illustrates that research and technology development are not insular activities, but integrated processes that together constitute a system.
Following general workshop discussion, a number of common issues emerged among the groups. These centered around the research life cycle, communicating the value of exploratory advanced research, and continued project funding. It was felt that there is a general need to better describe the research and deployment cycle specific to highway transportation and possibly to highway research fields, such as materials or system planning. Research life cycle diagrams show a very linear, chronological process but it is not necessarily that way in reality." [fhwa.dot.gov/ advancedresearch/ pubs/ 11034/ ]
The arrow loop diagram example "Innovation life cycle" was created using the ConceptDraw PRO diagramming and vector drawing software extended with the Target and Circular Diagrams solution from the Marketing area of ConceptDraw Solution Park.
www.conceptdraw.com/ solution-park/ marketing-target-and-circular-diagrams
Process Flowchart
ConceptDraw is Professional business process mapping software for making process flow diagram, workflow diagram, general flowcharts and technical illustrations for business documents. It is includes rich examples, templates, process flowchart symbols. ConceptDraw flowchart maker allows you to easier create a process flowchart. Use a variety of drawing tools, smart connectors, flowchart symbols and shape libraries to create flowcharts of complex processes, process flow diagrams, procedures and information exchange.
 Target and Circular Diagrams
This solution extends ConceptDraw PRO software with samples, templates and library of design elements for drawing the Target and Circular Diagrams.
Structured Systems Analysis and Design Method (SSADM) with ConceptDraw PRO
Structured Systems Analysis and Design Method SSADM is the method which is used at projecting and analysis of information systems. SSADM is based on the data flow diagrams. At the description of data flows out of the system and into the system DFD, which denote boundaries of the system, are used.Swot Analysis Examples for Mac OSX
SWOT Analysis solution from ConceptDraw Solution Park extends ConceptDraw MINDMAP and ConceptDraw PRO software with easy-to-use SWOT Analysis tools for Mac OSX and Windows.Competitor Analysis
Competitor analysis is a first and obligatory step in elaboration the proper corporate marketing strategy and creating sustainable competitive advantage. Use powerful opportunities of numerous solutions from ConceptDraw Solution Park for designing illustrative diagrams, charts, matrices which are necessary for effective competitor analysis.- Draw With Description The Research Process Lifecycle
- Target and Circular Diagrams | Research cycle - Circle diagram ...
- Research cycle - Circle diagram | Innovation life cycle - Arrow loop ...
- Research cycle - Circle diagram | Best Program to Make Workflow ...
- Process Flowchart | Structured Systems Analysis and Design ...
- Draw With Discription The Research Process Lifecycle
- Project management life cycle - Flowchart | Basic Diagramming ...
- Draw Flowcharts with ConceptDraw | Circular Arrows Diagrams ...
- Process Flowchart | Using A Fully Labelled Flowchart Illustrate The ...
- Circular arrows diagram - SDLC | Model development life cycle ...
- Innovation life cycle - Arrow loop diagram | Strategic planning ...
- Circular arrows diagram - BPM life cycle | Innovation life cycle ...
- Cycle Diagram Software
- Product life cycle process - Flowchart | BPM life cycle | Innovation life ...
- Target and Circular Diagrams | Innovation life cycle - Arrow loop ...
- Why Is The System Life Cycle A Circular Process
- Innovation life cycle - Arrow loop diagram
- Model development life cycle - IDEF0 diagram | Systems ...
- Process Flowchart | Fully Labled Flowchart That Illustrates The ...
- Water cycle diagram | Innovation life cycle - Arrow loop diagram ...
- ERD | Entity Relationship Diagrams, ERD Software for Mac and Win
- Flowchart | Basic Flowchart Symbols and Meaning
- Flowchart | Flowchart Design - Symbols, Shapes, Stencils and Icons
- Flowchart | Flow Chart Symbols
- Electrical | Electrical Drawing - Wiring and Circuits Schematics
- Flowchart | Common Flowchart Symbols
- Flowchart | Common Flowchart Symbols


