Bubble diagrams in Landscape Design with ConceptDraw DIAGRAM

HelpDesk
How to Create an IDEF0 Diagram for an Application Development

HelpDesk
How to Draw a Block Diagram

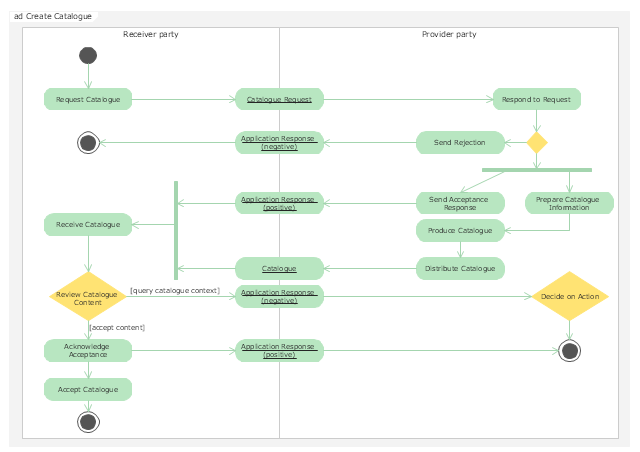
"Activity diagrams are graphical representations of workflows of stepwise activities and actions with support for choice, iteration and concurrency. In the Unified Modeling Language, activity diagrams are intended to model both computational and organisational processes (i.e. workflows). Activity diagrams show the overall flow of control." [Activity diagram. Wikipedia]
The UML activity diagram example "Catalogue creation process" was created using the ConceptDraw PRO diagramming and vector drawing software extended with the Rapid UML solution from the Software Development area of ConceptDraw Solution Park.
The UML activity diagram example "Catalogue creation process" was created using the ConceptDraw PRO diagramming and vector drawing software extended with the Rapid UML solution from the Software Development area of ConceptDraw Solution Park.
UML activity diagram
HelpDesk
How to Create a BPMN Diagram

HelpDesk
How to Create an Enterprise Architecture Diagram

 Enterprise Architecture Diagrams
Enterprise Architecture Diagrams solution extends ConceptDraw DIAGRAM software with templates, samples and library of vector stencils for drawing the diagrams of enterprise architecture models.
- Data Flow Diagrams | Data Flow Diagrams | How to Create a Data ...
- How To Create a Bubble Chart | Best Diagramming Software for Mac ...
- Entity-Relationship Diagram (ERD) with ConceptDraw PRO ...
- Diagramming Software for Design UML Activity Diagrams | UML ...
- How to Add a Bubble Diagram to a PowerPoint Presentation Using ...
- Creation To Sales Process Flow Diagram
- Advertising creation process - Conversation BPMN 2.0 diagram ...
- UML activity diagram - Catalogue creation process | Rapid UML ...
- UML Diagram | Computer Network Diagrams | AWS Architecture ...
- Advertising Diagram Model
- Data Flow Diagram
- Enterprise Architecture Diagrams | How to Create an Enterprise ...
- Wireless Networks | Wireless Network Diagram Examples | How to ...
- Data Flow Diagrams | How to Create a Data Flow Diagram using ...
- Bubble diagrams in Landscape Design with ConceptDraw PRO ...
- Electrical Engineering | How to Create an Electrical Diagram Using ...
- UML activity diagram - Catalogue creation process
- Timeline Diagrams | Timeline Examples | How to Create a Timeline ...
- Creating A Account Example Dfd
- Data Flow Diagrams | Process Flowchart | Visio Files and ...
- ERD | Entity Relationship Diagrams, ERD Software for Mac and Win
- Flowchart | Basic Flowchart Symbols and Meaning
- Flowchart | Flowchart Design - Symbols, Shapes, Stencils and Icons
- Flowchart | Flow Chart Symbols
- Electrical | Electrical Drawing - Wiring and Circuits Schematics
- Flowchart | Common Flowchart Symbols
- Flowchart | Common Flowchart Symbols