Taxi Service Data Flow Diagram DFD Example

UML Use Case Diagram Example - Taxi Service
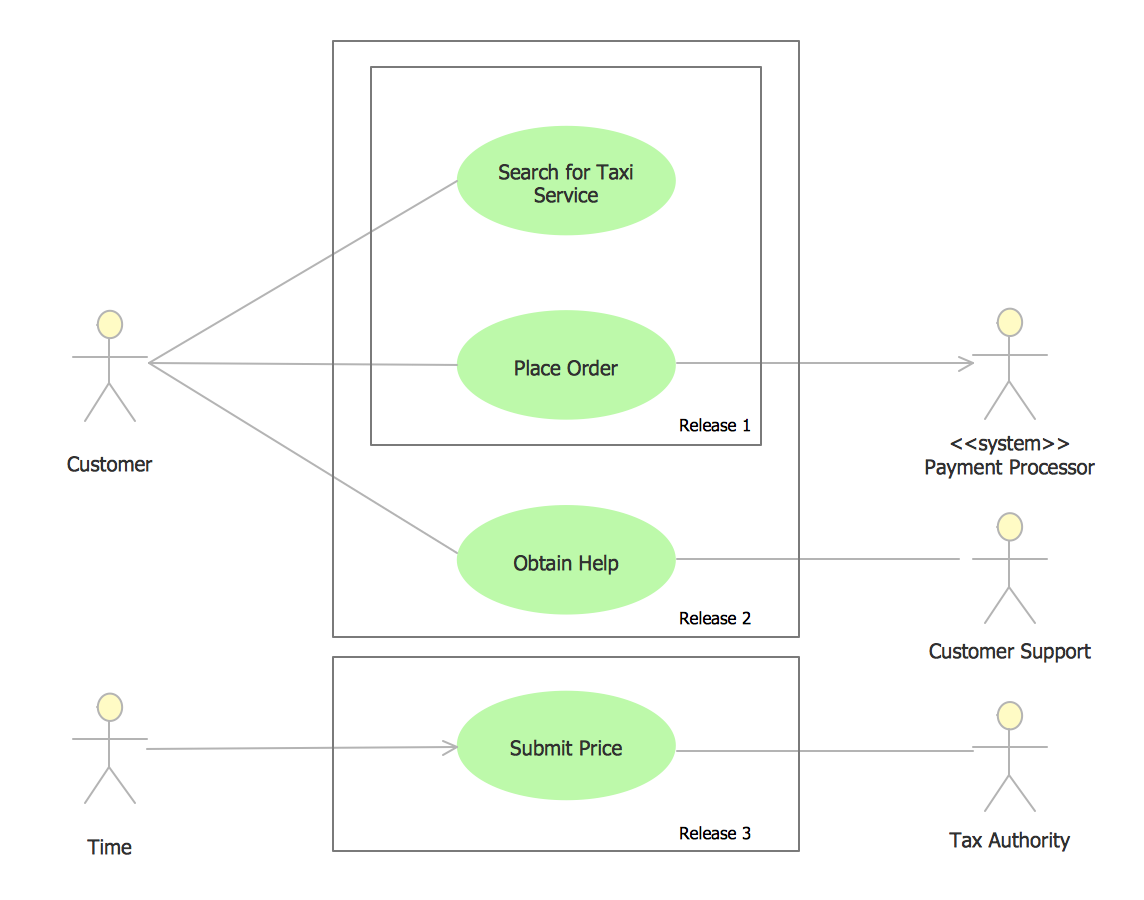
This sample shows the work of the taxi service and is used by taxi stations, by airports, in the tourism field and delivery service.
Data Flow Diagram Software

ConceptDraw DIAGRAM is a powerful Data Flow Diagram Software thanks to the Data Flow Diagrams solution from the Software Development area of ConceptDraw Solution Park.
You can use the predesigned DFD vector objects that are grouped in 3 libraries of Data Flow Diagrams solution: Data Flow Diagrams Library; Gane-Sarson Notation Library; Yourdon and Coad Notation Library.
Process Flowchart


Types of Flowchart - Overview


Flow chart Example. Warehouse Flowchart

Standard warehousing process flow diagram and standard workflow diagram used for process identification for further evaluating effectiveness and profitability of overall business process. Use the ConceptDraw DIAGRAM diagramming and vector drawing software extended with the Flowcharts solution from the Diagrams area of ConceptDraw Solution Park to design your own workflow diagrams, process flow diagram and flow charts. Need to use Process Flow Diagram for designing Warehouse packages flow.

 Telecommunication Network Diagrams
Telecommunication Network Diagrams solution extends ConceptDraw DIAGRAM software with samples, templates, and great collection of vector stencils to help the specialists in a field of networks and telecommunications, as well as other users to create Computer systems networking and Telecommunication network diagrams for various fields, to organize the work of call centers, to design the GPRS networks and GPS navigational systems, mobile, satellite and hybrid communication networks, to construct the mobile TV networks and wireless broadband networks.
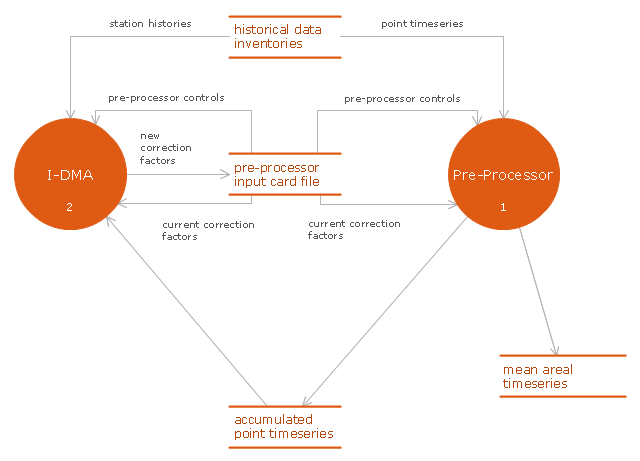
This DFD sample was created on the base of figure illustrating the "Interactive Double Mass Analysis. User's Guide" from the website of the Office of Hydrologic Development of the National Weather Service (NWS) of the National Oceanic and Atmospheric Administration (NOAA).
"Double mass analysis is a technique commonly employed to determine corrections to hydrometeorological data to account for changes in data collection procedures or other local conditions. The changes may result from a variety of things including changes in instrumentation, changes in observation procedures, or changes in gage location or surrounding conditions. The purpose of this Interactive Double Mass Analysis (IDMA) tool is to provide an effective and efficient way for users to perform consistency checking using double mass analysis and to produce the correction factors that are used in subsequent processing by NWSRFS preprocessor tools to account for any discovered inconsistencies.
Computations of mean areal time series for use in calibration and ESP have traditionally been made using the appropriate preprocessing software (MAP, PXPP, MAT etc.). The preprocessors have traditionally taken point time series as input and have provided facilities for estimation of missing data, and for consistency checking and correction in addition to the mean areal computations. The IDMA tool has been designed to run in conjunction with the preprocessors in an iterative fashion. It performs the consistency checking function, leaving the estimation, correction and mean areal computations to the preprocessors. ...
As shown in Figure ... the preprocessor software generates a data file that contains accumulated data values for each station and the associated group base, as well as flags indicating whether the values were estimated or not. This data file along with the input card file used by the preprocessor are used by the IDMA tool. The IDMA tool then allows the user to perform consistency checks and to calculate correction factors. The correction factors are then returned so that the preprocessors can perform the corrections, re-estimate missing data and perform the mean areal computations. Note that there is an interdependence between the estimation of missing values in the preprocessors and the correction factors computed in the IDMA and so there needs to be iteration between the two processes until the user is satisfied that an appropriate balance has been reached."
[nws.noaa.gov/ oh/ hrl/ idma/ users_ guide/ html/ dma_ overview.php]
The example "Interaction between IDMA and preprocessor" was created using the ConceptDraw PRO diagramming and vector drawing software extended with the Data Flow Diagrams solution from the Software Development area of ConceptDraw Solution Park.
DFD
Workflow Diagram Software

The best workflow diagram software you may find is ConceptDraw DIAGRAM. ConceptDraw DIAGRAM is world-known diagramming software that works for both Windows and Mac OS X platforms. The software contains complete set of features allows to draw diagrams faster. ConceptDraw DIAGRAM extended with the Workflow Diagram solution provides additional libraries, templates and samples for drawing professional workflow diagrams.
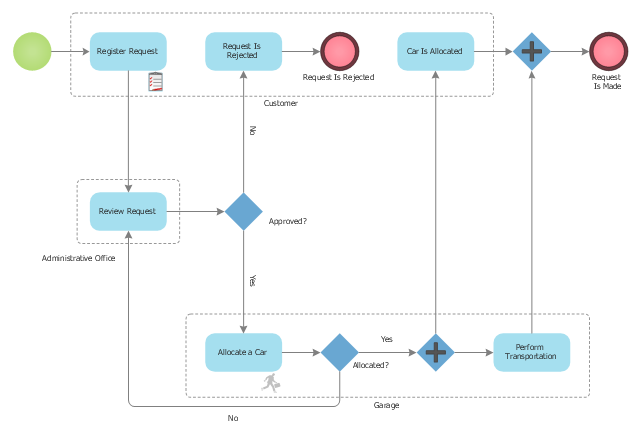
This BPMN (Business Process Model and Notation) diagram sample represents the taxi service order procedure workflow.
"A business process or business method is a collection of related, structured activities or tasks that produce a specific service or product (serve a particular goal) for a particular customer or customers. It often can be visualized with a flowchart as a sequence of activities with interleaving decision points or with a Process Matrix as a sequence of activities with relevance rules based on data in the process. ...
There are three types of business processes:
(1) Management processes, the processes that govern the operation of a system. Typical management processes include "corporate governance" and "strategic management".
(2) Operational processes, processes that constitute the core business and create the primary value stream. Typical operational processes are purchasing, manufacturing, advertising and marketing, and sales.
(3) Supporting processes, which support the core processes. Examples include accounting, recruitment, call center, technical support. ...
The ... improvement areas are equally applicable to policies, processes and detailed procedures (sub-processes/ tasks). There is a cascading effect of improvements made at a higher level on those made at a lower level.
For instance, if a recommendation to replace a given policy with a better one is made with proper justification and accepted in principle by business process owners, then corresponding changes in the consequent processes and procedures will follow naturally in order to enable implementation of the policies" [Business process. Wikipedia]
The business process modeling diagram example "Taxi service order procedure - BPMN 1.2 diagram" was created using the ConceptDraw PRO diagramming and vector drawing software extended with the Business Process Diagram solution from the Business Processes area of ConceptDraw Solution Park.
Business process modeling
- Vehicle Service Station Dfd
- Data Flow Diagram Service Station
- Process Flowchart | Directional Maps | Vehicles Service Center Dfd
- Data Flow Diagram Vehicle Service Center
- Automobile Service Station Software Flow Diagram
- Service Station Flow Chart Drawing
- Service Station Design Diagram
- Aerospace and Transport | Gas Station Flowchart With Visio
- Class Diagram Of Service Station
- Service Blueprint Of Car Service Station
- ERD | Entity Relationship Diagrams, ERD Software for Mac and Win
- Flowchart | Basic Flowchart Symbols and Meaning
- Flowchart | Flowchart Design - Symbols, Shapes, Stencils and Icons
- Flowchart | Flow Chart Symbols
- Electrical | Electrical Drawing - Wiring and Circuits Schematics
- Flowchart | Common Flowchart Symbols
- Flowchart | Common Flowchart Symbols