HelpDesk
How to Create a Data Flow Diagram using ConceptDraw PRO
 example")
The vector stencils library "DFD, Gane-Sarson notation" contains 12 DFD elements.
Use it for drawing data flow diagrams (DFD) using Gane-Sarson notation in the ConceptDraw PRO diagramming and vector drawing software extended with the Data Flow Diagrams solution from the Software Development area of ConceptDraw Solution Park.
Use it for drawing data flow diagrams (DFD) using Gane-Sarson notation in the ConceptDraw PRO diagramming and vector drawing software extended with the Data Flow Diagrams solution from the Software Development area of ConceptDraw Solution Park.
External Entity
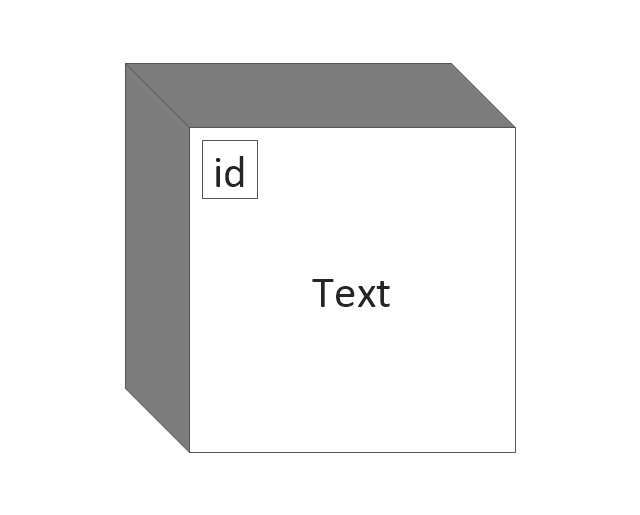
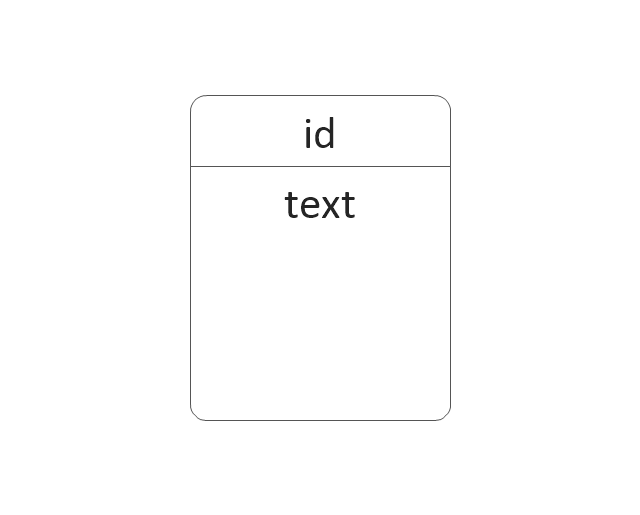
Process
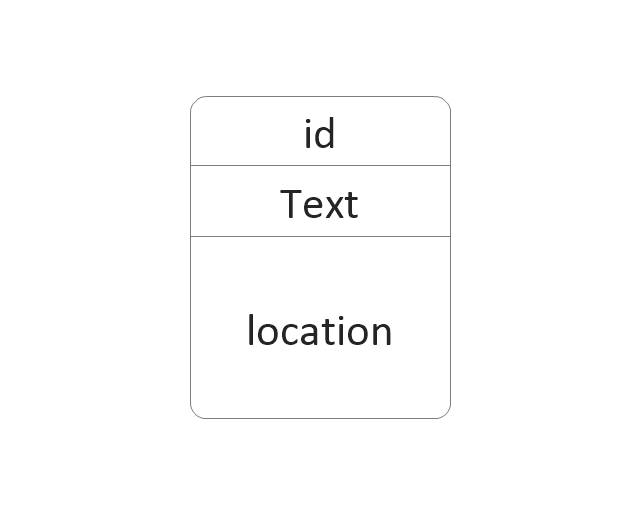
Process w / Location
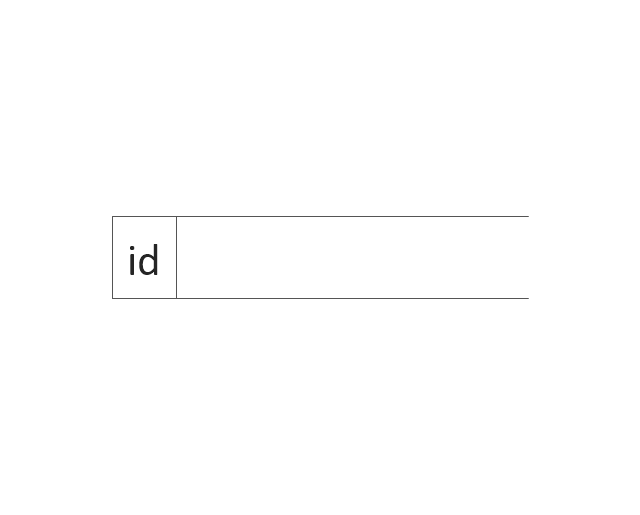
Data Store
Jump
Angled Connector
Angled Connector 2
Top to Bottom Variable
Bottom to Side
Side to Side
Side to Same Side
Top to Top Side
The vector stencils library "DFD, Gane-Sarson notation" contains 12 DFD elements.
Use it for drawing data flow diagrams (DFD) using Gane-Sarson notation in the ConceptDraw PRO diagramming and vector drawing software extended with the Data Flow Diagrams solution from the Software Development area of ConceptDraw Solution Park.
Use it for drawing data flow diagrams (DFD) using Gane-Sarson notation in the ConceptDraw PRO diagramming and vector drawing software extended with the Data Flow Diagrams solution from the Software Development area of ConceptDraw Solution Park.
External Entity
Process
Process w / Location
Data Store
Jump
Angled Connector
Angled Connector 2
Top to Bottom Variable
Bottom to Side
Side to Side
Side to Same Side
Top to Top Side
ConceptDraw Arrows10 Technology

Cross Functional Flowchart for Business Process Mapping

Use a variety of drawing tools, smart connectors and shape libraries to create flowcharts of complex processes, procedures and information exchange. Define and document basic work and data flows, financial, production and quality management processes to increase efficiency of you business.
 Data Flow Diagrams (DFD)
Data Flow Diagrams solution extends ConceptDraw PRO software with templates, samples and libraries of vector stencils for drawing the data flow diagrams (DFD).
- Dfd Connector Symbol
- VGA connector pinout | Electrical Symbols, Electrical Diagram ...
- Gane Sarson Diagram | DFD , Gane-Sarson notation - Vector stencils ...
- Data Flow Diagram Symbols. DFD Library | Basic Flowchart ...
- DFD , Gane-Sarson notation - Vector stencils library | Gane Sarson ...
- Data Flow Diagrams ( DFD ) | Audio and Video Connectors | Process ...
- Audio, Video, Media | Audio and Video Connectors | Artwork | Dfd ...
- Connector Usage In System Flow Diagram
- Data Flow Diagrams ( DFD ) | Soccer | Audio and Video Connectors ...
- DFD , Gane-Sarson notation - Vector stencils library
- Process Flowchart | Data Flow Diagrams ( DFD ) | Audio and Video ...
- Data Flow Diagram ( DFD )
- Basic Flowchart Symbols and Meaning | Data Flow Diagram ...
- Process Flowchart | DFD Library System | Block Diagram Creator ...
- Data Flow Diagrams ( DFD ) | ConceptDraw Solution Park | Audio ...
- Example of DFD for Online Store ( Data Flow Diagram ) DFD ...
- How To use House Electrical Plan Software | Basic Flowchart ...
- Data Flow Diagrams ( DFD ) | Process Flowchart | How to Create a ...
- Data Flow Diagram ( DFD ) | Design elements - Bathroom | DFD ...
- Data Flow Diagram Symbols. DFD Library | Process Flowchart ...
- ERD | Entity Relationship Diagrams, ERD Software for Mac and Win
- Flowchart | Basic Flowchart Symbols and Meaning
- Flowchart | Flowchart Design - Symbols, Shapes, Stencils and Icons
- Flowchart | Flow Chart Symbols
- Electrical | Electrical Drawing - Wiring and Circuits Schematics
- Flowchart | Common Flowchart Symbols
- Flowchart | Common Flowchart Symbols