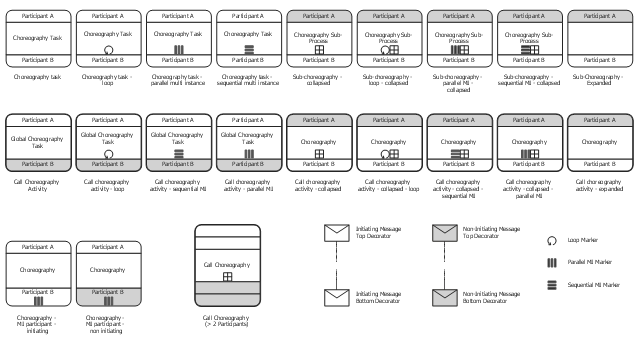
The vector stencils library "Choreographies" contains 28 symbols of choreography tasks, collapsed and expanded choreography sub-processes for drawing business process diagrams (BPMN 2.0).
"Choreography – Tasks performed by
participants and how participants
coordinate interactions via messages. ...
BPMN Choreography.
(1) Sequence of interactions between Participants.
(2) Choreographies exist outside of or in between Pools.
(3) A Choreography Task is an atomic Activity in a Choreography Process.
(4) The task represents an Interaction, which is one or two Message exchanges between two Participants.
(5) Helps to show who initiates the activity and the first message." [omg.org/ news/ meetings/ workshops/ SOA-HC/ presentations-2011/ 14_ MT-2_ Brookshier.pdf]
The shapes example "Design elements - Choreographies BPMN 2.0" is included in the Business Process Model and Notation solution from the Business Processes area of ConceptDraw Solution Park.
BPMN 2.0 choreography symbols
HelpDesk
How to Draw a Scatter Diagram Using ConceptDraw PRO

HelpDesk
How to Draw a Pareto Chart

ConceptDraw Seven Basic Tools of Quality solution delivers a big set of vector stencil libraries and samples for each quality control diagram, including a Pareto chart.
Good Flow Chart app for Mac

Notation & Symbols for ERD

A complete set of work flow shapes, notation & symbols for ERD, entity relationship stencils, included in Entity-Relationship Diagram (ERD) solution for ConceptDraw PRO software, makes drawing diagrams based on ERD notation as smooth as possible.
Flow chart Example. Warehouse Flowchart

Standard warehousing process flow diagram and standard workflow diagram used for process identification for further evaluating effectiveness and profitability of overall business process. Use the ConceptDraw PRO diagramming and vector drawing software extended with the Flowcharts solution from the Diagrams area of ConceptDraw Solution Park to design your own workflow diagrams, process flow diagram and flow charts. Need to use Process Flow Diagram for designing Warehouse packages flow.

Diagramming Software for Design UML Collaboration Diagrams


HR Management Software

The HR Management Software is an incredibly powerful tool for those who need to analyze or present human resource process flows in a visually effective manner.
Competitor Analysis

Process with UML

This sample was created in ConceptDraw PRO diagramming and vector drawing software using the Rapid UML Solution from the Software Development area of ConceptDraw Solution Park.
- Design Coordination Bpmn
- Logistics - Choreography BPMN 2.0 diagram | Business Process ...
- Design elements - Choreographies BPMN 2.0 | Design elements ...
- Logistics - Choreography BPMN 2.0 diagram | Design elements ...
- Design elements - Swimlanes BPMN 2.0 | Design elements - Events ...
- Design elements - Activities BPMN 2.0 | Design elements ...
- Design elements - Choreographies BPMN 2.0 | Social Brand ...
- Design elements - Choreographies BPMN 2.0 | Soa Diagram
- BPMN 2.0 | Cab booking public process - Collaboration BPMN 2.0 ...
- Design elements - Connections BPMN1.2 | Design elements ...
- ERD | Entity Relationship Diagrams, ERD Software for Mac and Win
- Flowchart | Basic Flowchart Symbols and Meaning
- Flowchart | Flowchart Design - Symbols, Shapes, Stencils and Icons
- Flowchart | Flow Chart Symbols
- Electrical | Electrical Drawing - Wiring and Circuits Schematics
- Flowchart | Common Flowchart Symbols
- Flowchart | Common Flowchart Symbols