Basic Flowchart Symbols and Meaning
Flowchart Symbols and Meaning - Provides a visual representation of basic flowchart symbols and their proposed use in professional workflow diagram, standard process flow diagram and communicating the structure of a well-developed web site, as well as their correlation in developing on-line instructional projects. See flowchart's symbols by specifics of process flow diagram symbols and workflow diagram symbols.
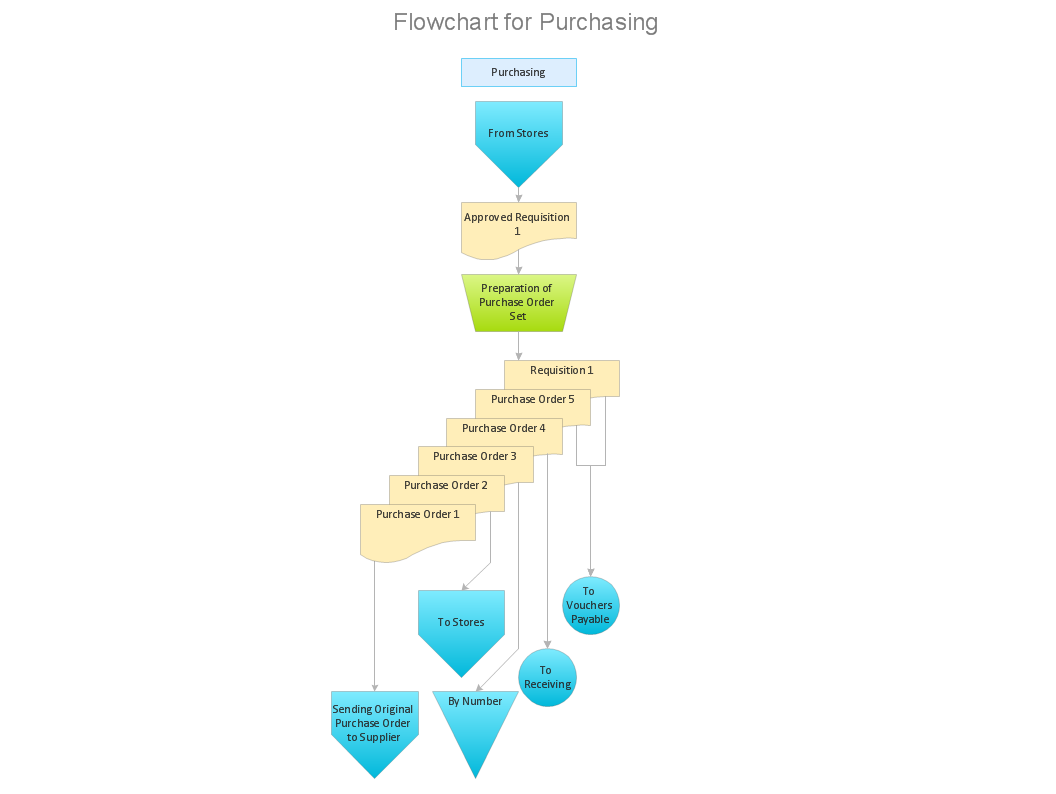
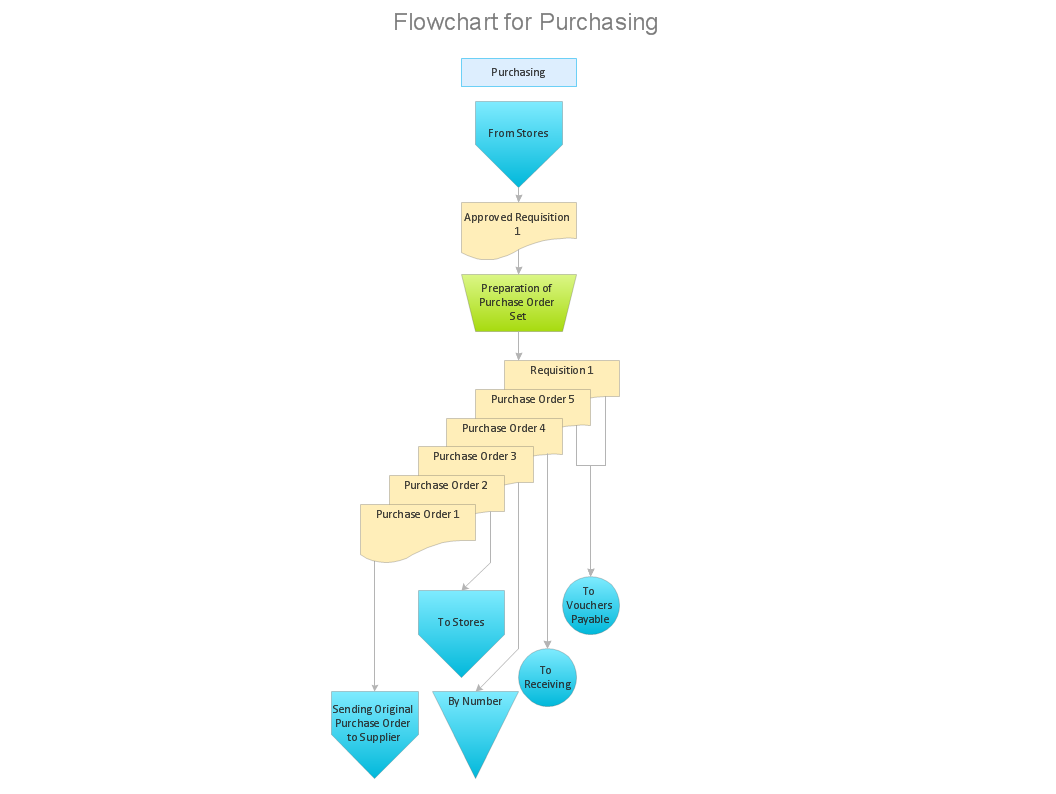
Purchase Process Flow Chart, Receiving Process Flow Chart, Accounting Flowchart Example.
The purchasing process follows very specific guidelines and includes a purchasing cycle flowchart and receiving process flow chart. Common key elements of purchasing process.It is important to know how purchasing processes work and how each operation is done.
Process Flowchart
ConceptDraw is Professional business process mapping software for making process flow diagram, workflow diagram, general flowcharts and technical illustrations for business documents. It is includes rich examples, templates, process flowchart symbols. ConceptDraw flowchart maker allows you to easier create a process flowchart. Use a variety of drawing tools, smart connectors, flowchart symbols and shape libraries to create flowcharts of complex processes, process flow diagrams, procedures and information exchange.
How well does Your Purchase Process Flow?
The purchasing process follows very specific guidelines and includes an purchasing cycle flowchart. Common key elements of purchasing process.Material Requisition Flowchart. Flowchart Examples
Create your own material requisition flow charts using the ConceptDraw PRO diagramming and vector drawing software extended with the Flowcharts solution from the Diagrams area of ConceptDraw Solution Park.The flowchart example shows the material requisition business process.
Why Flowchart Important to Accounting Information System?
The Accounting flowchart shows how information flows from source documents through the accounting records. The are based on the accounting procedures or processes.Flowcharts are used to represent accounting information in a system . There are special symbols which are used to create accounting flowcharts. Try conceptdraw flowcharting set of symbols to draw a professional charts.
Cross-Functional Flowchart
Cross-Functional Flowchart - to draw cross functional process maps is by starting with a cross-functional flowchart samples and templates. Easy to draw sample cross functional Process Flow Diagrams. Using a Cross-Functional flowchart is a clear way of showing each team member’s responsibilities and how processes get shared or transferred between different teams and departments.Use cross-functional flowcharts to show the relationship between a business process and the functional units (such as departments) responsible for that process. To create it use the best flowchart maker of ConceptDraw PRO.

Accounting Flowchart Purchasing Receiving Payable and Payment
Accounting flowchart is a pictorial way to represent the flow of data in an organization and the flow of transactions process in a specific area of its accounting or financial department. Accounting Flowcharts solution contains the full set of standardized accounting flowchart symbols which will help you design in minutes various types of Accounting Flowcharts including such popular diagrams which represent the whole accounting process: Purchasing Flowchart, Receiving Flowchart, Voucher Payable Flowchart, Treasurer Flowchart, Payment Flowchart.How to Make an Accounting Process Flowchart
Tips on how to make an accounting flowchart. Describing methods and symbols that are used to represent the accounting system.How to Create Flowcharts for an Accounting Information System
Accounting information is a system of processes to represent financial and accounting data that is used by decision makers. To represent accounting processes there are special symbols which are used to create accounting flowcharts.Flowcharts help users of Accounting Information System to understand the step sequences of accounting processes. Use ConceptDraw PRO with Accounting Flowcharts solution to document and communicate visually how accounting processes work, and how each operation is done.
What can go wrong if the purchasing process is not followed?
Make sure that your purchasing process complies with the standards and regulations. Common key elements of purchasing process.Data Flow Diagram
Data flow diagram (DFD) is the part of the SSADM method (Structured Systems Analysis and Design Methodology), intended for analysis and information systems projection. Data flow diagrams are intended for graphical representation of data flows in the information system and for analysis of data processing during the structural projection. Data flow diagram often used in connection with human process and can be displayed as workflow diagram. The critical Process Flow Diagram is another flowchart technique for designing data flow in connection with organizational processes. The critical Process flow diagram may use different range of symbols than a classic workflow diagram.Why is it important to have a formal purchasing process?
What is Purchasing Process and How to Meet The Standards. Common key elements of purchasing process representation.Workflow to Make a Purchase. Accounting Flowchart Example
Purchasing Workflow Chart as a methods for documenting accounting information systems. Symbols and Methods for designing Accounting System.Check Order Process Flowchart. Flowchart Examples
This sample was created in ConceptDraw PRO diagramming and vector drawing software using the Flowcharts solution from the Diagrams area of ConceptDraw Solution Park.This sample shows the Flowchart of the printing the elements of the binary search tree. They are printed in the order from lowest to greatest. On this diagram you can see the rectangles that represent the steps and decision points that are represented as diamonds with questions. It is necessary to make the decision that will determine the next step.
- Describe The Purchase Description Flow
- Basic Flowchart Symbols and Meaning | Purchase Process Flow ...
- Describe The Purchase Descriptions Flow
- The Purchase Description Flow
- Descibe The Purchase Description Flow
- Basic Flowchart Symbols and Meaning | Accounting Flowchart ...
- Explain Flow Chart Of Purchase Flow Cycle In Manufacturing Industry
- Explain Purchase Description Flow
- Basic Flow Of Purchasing
- Process Flowchart | Basic Flowchart Symbols and Meaning | Flow ...
- Basic Flowchart Symbols and Meaning | With An Aid Of Design A ...
- How to Make an Accounting Process Flowchart | Purchase Process ...
- Purchase Decision Flow
- Purchasing And Receiving Process Flow Chart
- Process Flowchart | Basic Flowchart Symbols and Meaning ...
- Purchase Process Flow Chart, Receiving Process Flow Chart
- Flow Chart Of Purchasing Process With Diagram
- How well does Your Purchase Process Flow ? | Pyramid Diagram ...
- Process Flowchart | Basic Flowchart Symbols and Meaning ...
- It Procurement Process Flow Chart
- ERD | Entity Relationship Diagrams, ERD Software for Mac and Win
- Flowchart | Basic Flowchart Symbols and Meaning
- Flowchart | Flowchart Design - Symbols, Shapes, Stencils and Icons
- Flowchart | Flow Chart Symbols
- Electrical | Electrical Drawing - Wiring and Circuits Schematics
- Flowchart | Common Flowchart Symbols
- Flowchart | Common Flowchart Symbols


