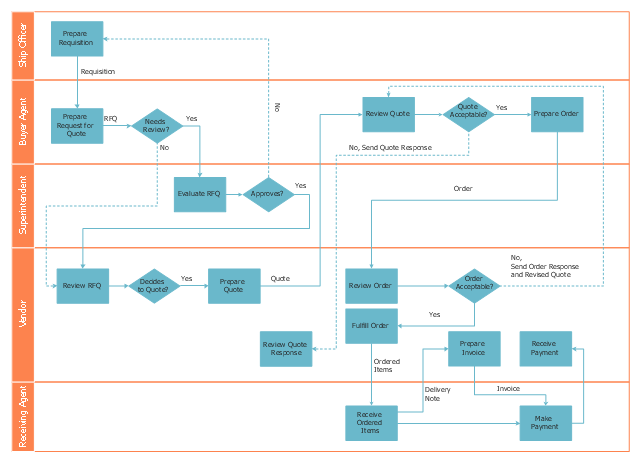
This deployment flow chart sample shows the trading process flow.
"Trade, also called goods exchange economy, is to transfer the ownership of goods from one person or entity to another by getting something in exchange from the buyer. Trade is sometimes loosely called commerce or financial transaction or barter. A network that allows trade is called a market. ...
Modern traders ... generally negotiate through a medium of exchange, such as money. As a result, buying can be separated from selling, or earning. ...
Retail trade consists of the sale of goods or merchandise from a very fixed location, such as a department store, boutique or kiosk, or by mail, in small or individual lots for direct consumption by the purchaser. Wholesale trade is defined as the sale of goods that are sold merchandise to retailers, to industrial, commercial, institutional, or other professional business users, or to other wholesalers and related subordinated services." [Trade. Wikipedia]
The swim lane diagram example "Deployment flowchart - Trading process diagram" was created using the ConceptDraw PRO diagramming and vector drawing software extended with the Cross-Functional Flowcharts solution from the Business Processes area of ConceptDraw Solution Park.
Swim lane diagram
UML Deployment Diagram. Diagramming Software for Design UML Diagrams


Deployment Chart Software

The Matrices solution offers you the useful tools for creating Deployment Charts in just minutes.
The Deployment Charts designed with ConceptDraw DIAGRAM are vector graphic documents and are available for reviewing, modifying, converting to a variety of formats (image, HTML, PDF file, MS PowerPoint Presentation, Adobe Flash or MS Visio XML), printing and send via e-mail in one moment.
UML Deployment Diagram

Use ConceptDraw DIAGRAM with UML deployment diagram templates, samples and stencil library from Rapid UML solution to model the physical deployment of artifacts on nodes of your software system.
Diagramming software for Amazon Web Service icon set: Monitoring, Deployment, Management
QFD | Quality Function Deployment Diagram

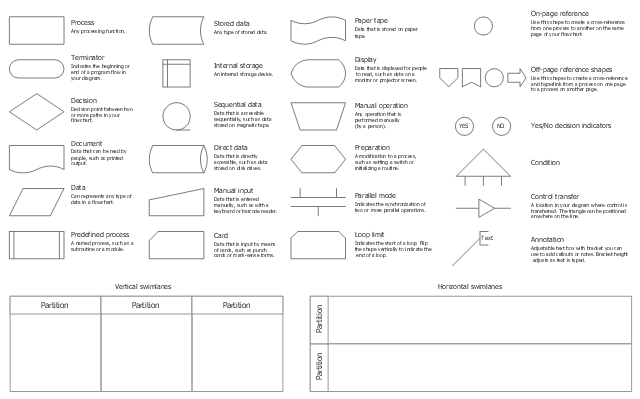
The vector stencils library "Process flowcharts" contains 30 symbols for creating the deployment flow charts, cross-functional flowcharts and swim lane diagrams using the ConceptDraw PRO diagramming and vector drawing software.
"A deployment flowchart (sometimes referred to as a "cross functional flowchart") is a business process mapping tool used to articulate the steps and stakeholders of a given process. ...
As deployment flowcharts highlight the relationships between stakeholders in addition to the process flow they are especially useful in highlighting areas of inefficiency, duplication or unnecessary processing. Often utilized within Six sigma activity, completed flowcharts are commonly used to examine the interfaces between “participants” which are typically causes for delays and other associated issues. Deployment flowcharts are useful for determining who within an organization is required to implement a process and are sometimes used as a business planning tool." [Deployment flowchart. Wikipedia]
The shapes example "Design elements - Process flowcharts" is included in the Process Flowcharts solution from the Business Processes area of ConceptDraw Solution Park.
Cross-functional flowchart shapes
Build a Flowchart Quickly With AutoConnect

 Business Process Mapping
The Business Process Mapping solution for ConceptDraw DIAGRAM is for users involved in process mapping and creating SIPOC diagrams.
 Cross-Functional Flowcharts
Cross-functional flowcharts are powerful and useful tool for visualizing and analyzing complex business processes which requires involvement of multiple people, teams or even departments. They let clearly represent a sequence of the process steps, the order of operations, relationships between processes and responsible functional units (such as departments or positions).
Business Process Elements: Activities


Cross-Functional Flowcharts in ConceptDraw

Cross-Functional Flowchart

Use cross-functional flowcharts to show the relationship between a business process and the functional units (such as departments) responsible for that process. To create it use the best flowchart maker of ConceptDraw DIAGRAM.

Powerful Drawing Feature for Creating Professional Diagrams

Quality Function Deployment

UML Deployment Diagram Example - ATM System UML diagrams

This sample shows the work of the ATM (Automated Teller Machine) banking system that is used for service and performing of the banking transactions using ATMs. System engineers can use comprehensive UML diagrams solution.
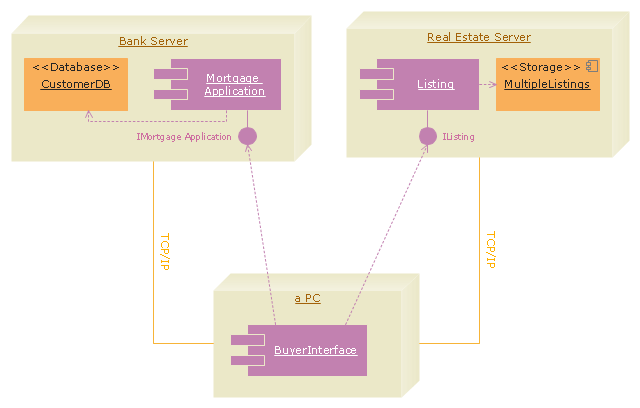
"A real estate transaction is the process whereby rights in a unit of property (or designated real estate) is transferred between two or more parties, e.g. in case of conveyance one party being the seller(s) and the other being the buyer(s). It can often be quite complicated due to the complexity of the property rights being transferred, the amount of money being exchanged, and government regulations. Conventions and requirements also vary considerably among different countries of the world and among smaller legal entities (jurisdictions).
In more abstract terms, a real estate transaction, like other financial transactions, causes transaction costs. To identify and possibly reduce these transaction costs, the Organization for Economic Co-operation and Development (OECD) addressed the issue through a study commissioned by the European Commission, and through a research action.
The mentioned research action ‘Modelling Real Property Transactions’ investigated methods to describe selected transactions in a formal way, to allow for comparisons across countries / jurisdictions. Descriptions were performed both using a more simple format, a Basic Use Case template, and more advanced applications of the Unified Modelling Language. Process models were compared through an ontology-based methodology, and national property transaction costs were estimated for Finland and Denmark, based on the directions of the United Nations System of National Accounts." [Real estate transaction. Wikipedia]
The UML deployment diagram example "Real estate transactions" was created using the ConceptDraw PRO diagramming and vector drawing software extended with the Rapid UML solution from the Software Development area of ConceptDraw Solution Park.
UML deployment diagram
 House of Quality
House of Quality solution provides the powerful drawing tools, numerous specific samples and examples, and set of vector design elements of House of Quality shapes and symbols, which will help you in application the Quality function deployment (QFD) methodology and in easy creation the House of Quality Matrices intended for satisfaction the consumers' desires and requirements, for representing them in a visual way and then transformation into the targets and technical requirements to be followed for development the best products.
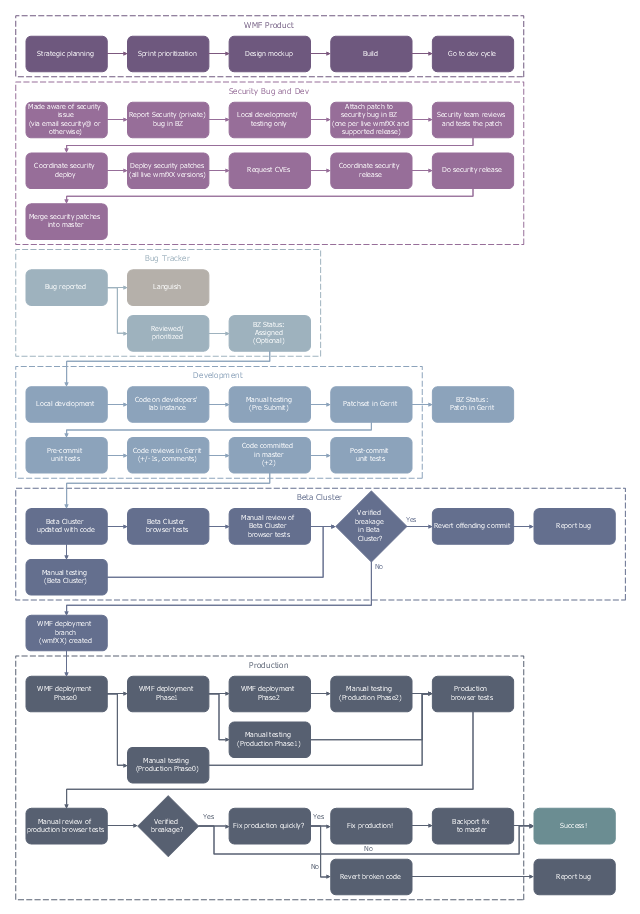
This business process flowchart example was redesigned from the Wikimedia Commons file: Wikimedia development and deployment flowchart.png.
[commons.wikimedia.org/ wiki/ File:Wikimedia_ development_ and_ deployment_ flowchart.png]
This file is made available under the Creative Commons CC0 1.0 Universal Public Domain Dedication. [creativecommons.org/ publicdomain/ zero/ 1.0/ deed.en]
"A deployment flowchart (sometimes referred to as a cross functional flowchart) is a business process mapping tool used to articulate the steps and stakeholders of a given process. ...
As deployment flowcharts highlight the relationships between stakeholders in addition to the process flow they are especially useful in highlighting areas of inefficiency, duplication or unnecessary processing." [Deployment flowchart. Wikipedia]
The business process map "Wikimedia development and deployment flowchart" was drawn using the ConceptDraw PRO diagramming and business graphics software extended with the Business Process Mapping solution from the Business Processes area of ConceptDraw Solution Park.
Business process map
Basic Audit Flowchart. Flowchart Examples

The Audit Flowcharts are widely used in the financial management, accounting, money management and in many others fields.
- Cross-Functional Flowchart | Types of Flowcharts | Cross-Functional ...
- Software Deployment Process Diagram
- Deployment flowchart - Trading process diagram | UML Deployment ...
- It Asset Deployment Process Chart
- Cross-Functional Flowcharts | Trading process diagram ...
- UML Deployment Diagram. Diagramming Software for Design UML ...
- Example Of Boutique Process Flow Chart
- UML Component Diagram | Process Flowchart | UML Deployment ...
- Deployment flowchart - Trading process diagram | Vertical Cross ...
- Deployment flowchart - Trading process diagram
- Trading process diagram - Deployment flowchart | Rapid UML | Flow ...
- UML Diagram Visio | UML Deployment Diagram. Diagramming ...
- UML Deployment Diagram | Process Flowchart | Entity-Relationship ...
- UML Deployment Diagram Example - ATM System UML diagrams ...
- Purchasing flowchart | Trading process diagram - Deployment ...
- Trading process diagram - Deployment flowchart | Vertical Cross ...
- Business Process Mapping | Deployment Diagram Of Online Fast ...
- Process Flowchart | UML Deployment Diagram. Design Elements ...
- UML use case diagram - Trading system usage scenarios | Trading ...
- UML Deployment Diagram. Design Elements
- ERD | Entity Relationship Diagrams, ERD Software for Mac and Win
- Flowchart | Basic Flowchart Symbols and Meaning
- Flowchart | Flowchart Design - Symbols, Shapes, Stencils and Icons
- Flowchart | Flow Chart Symbols
- Electrical | Electrical Drawing - Wiring and Circuits Schematics
- Flowchart | Common Flowchart Symbols
- Flowchart | Common Flowchart Symbols